I. Stratton

Design Research

Design research where architecture meets environmental performance and data.

Download the portfolio as a PDF

Projects

  1. Ecological territory
  2. Urban systems
  3. Building systems
  4. Material systems
01

Hillsborough EcoValuation Tool

Year
2025–2026
Type
GIS decision-support tool
Location
Hillsborough County, Florida
Second author
Dr. Kotryna Klizentyte, University of Florida
Role
GIS analysis, toolbox and web app development, documentation
Tools
ArcGIS Pro, ArcPy, Arcade, ArcGIS Experience Builder

A parcel-scale tool that puts a dollar value on what natural land does for a community, such as holding floodwater and storing carbon.

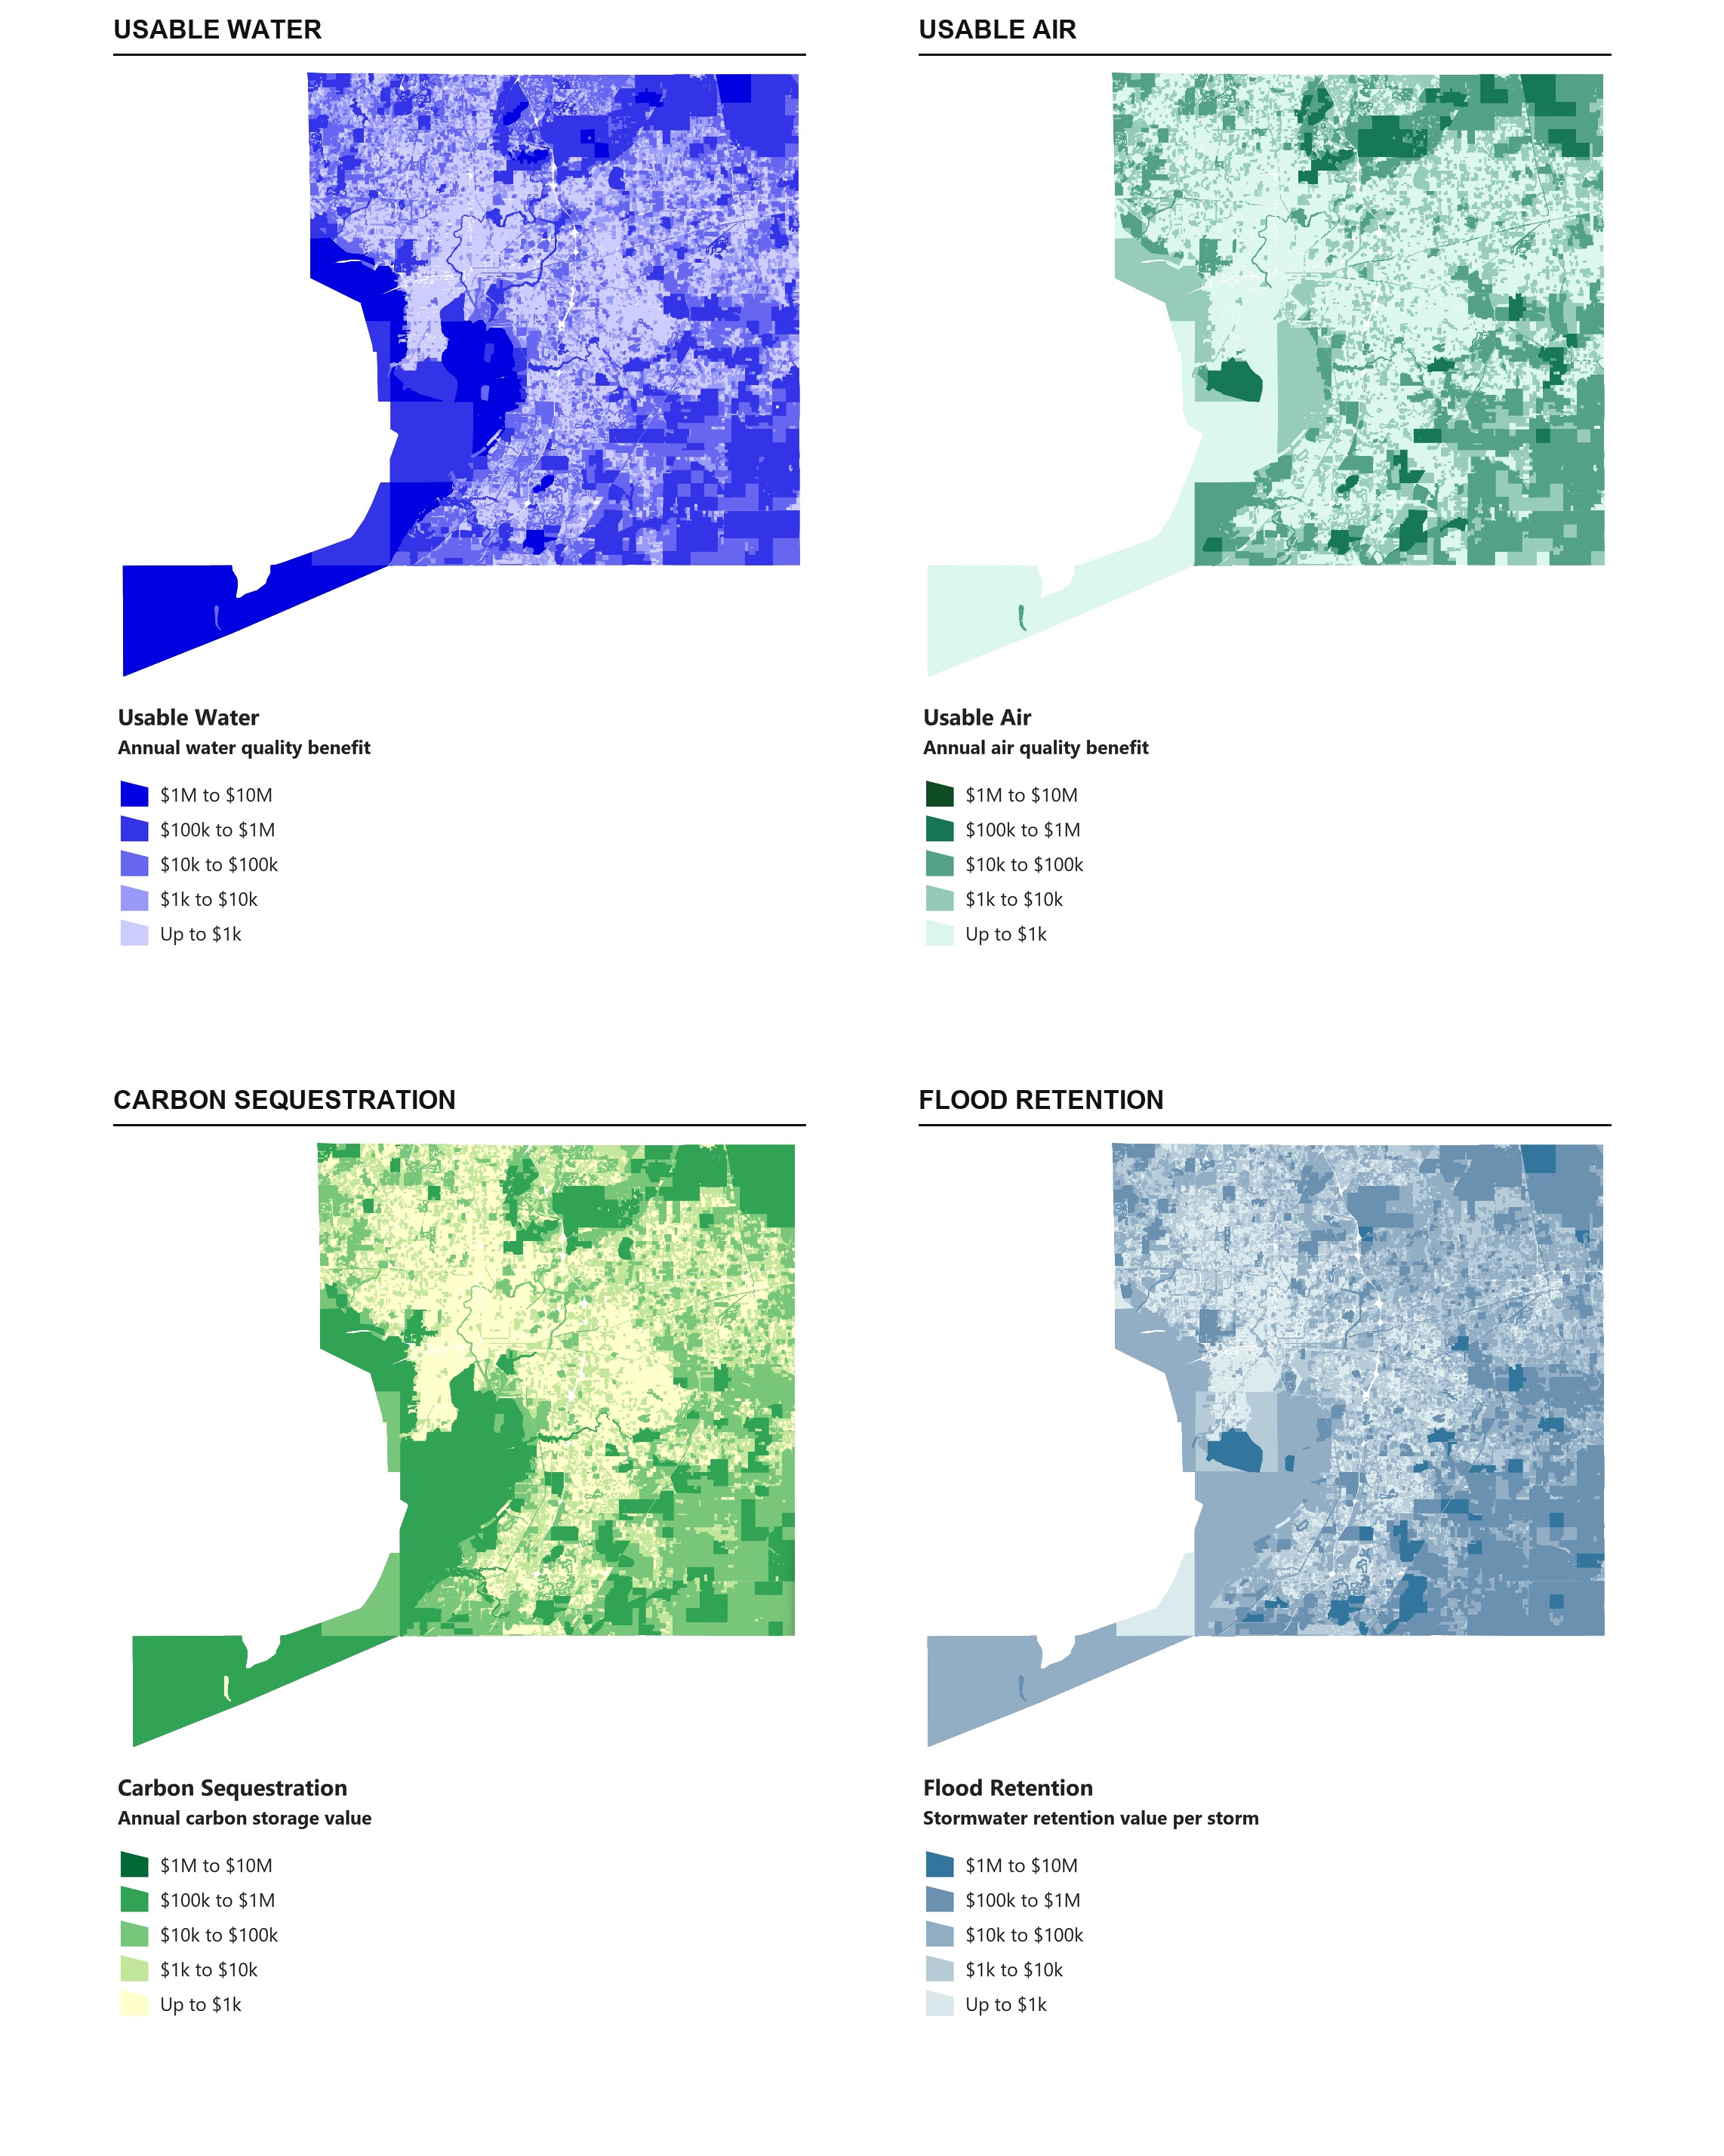
Land managers weighing conservation acquisitions rarely see the economic value of ecosystem services at the moment of decision. The tool adapts the U.S. EPA H2O / EnviroAtlas methodology to Hillsborough County and estimates four services for every parcel: flood water retention, usable air, usable water and carbon sequestration.

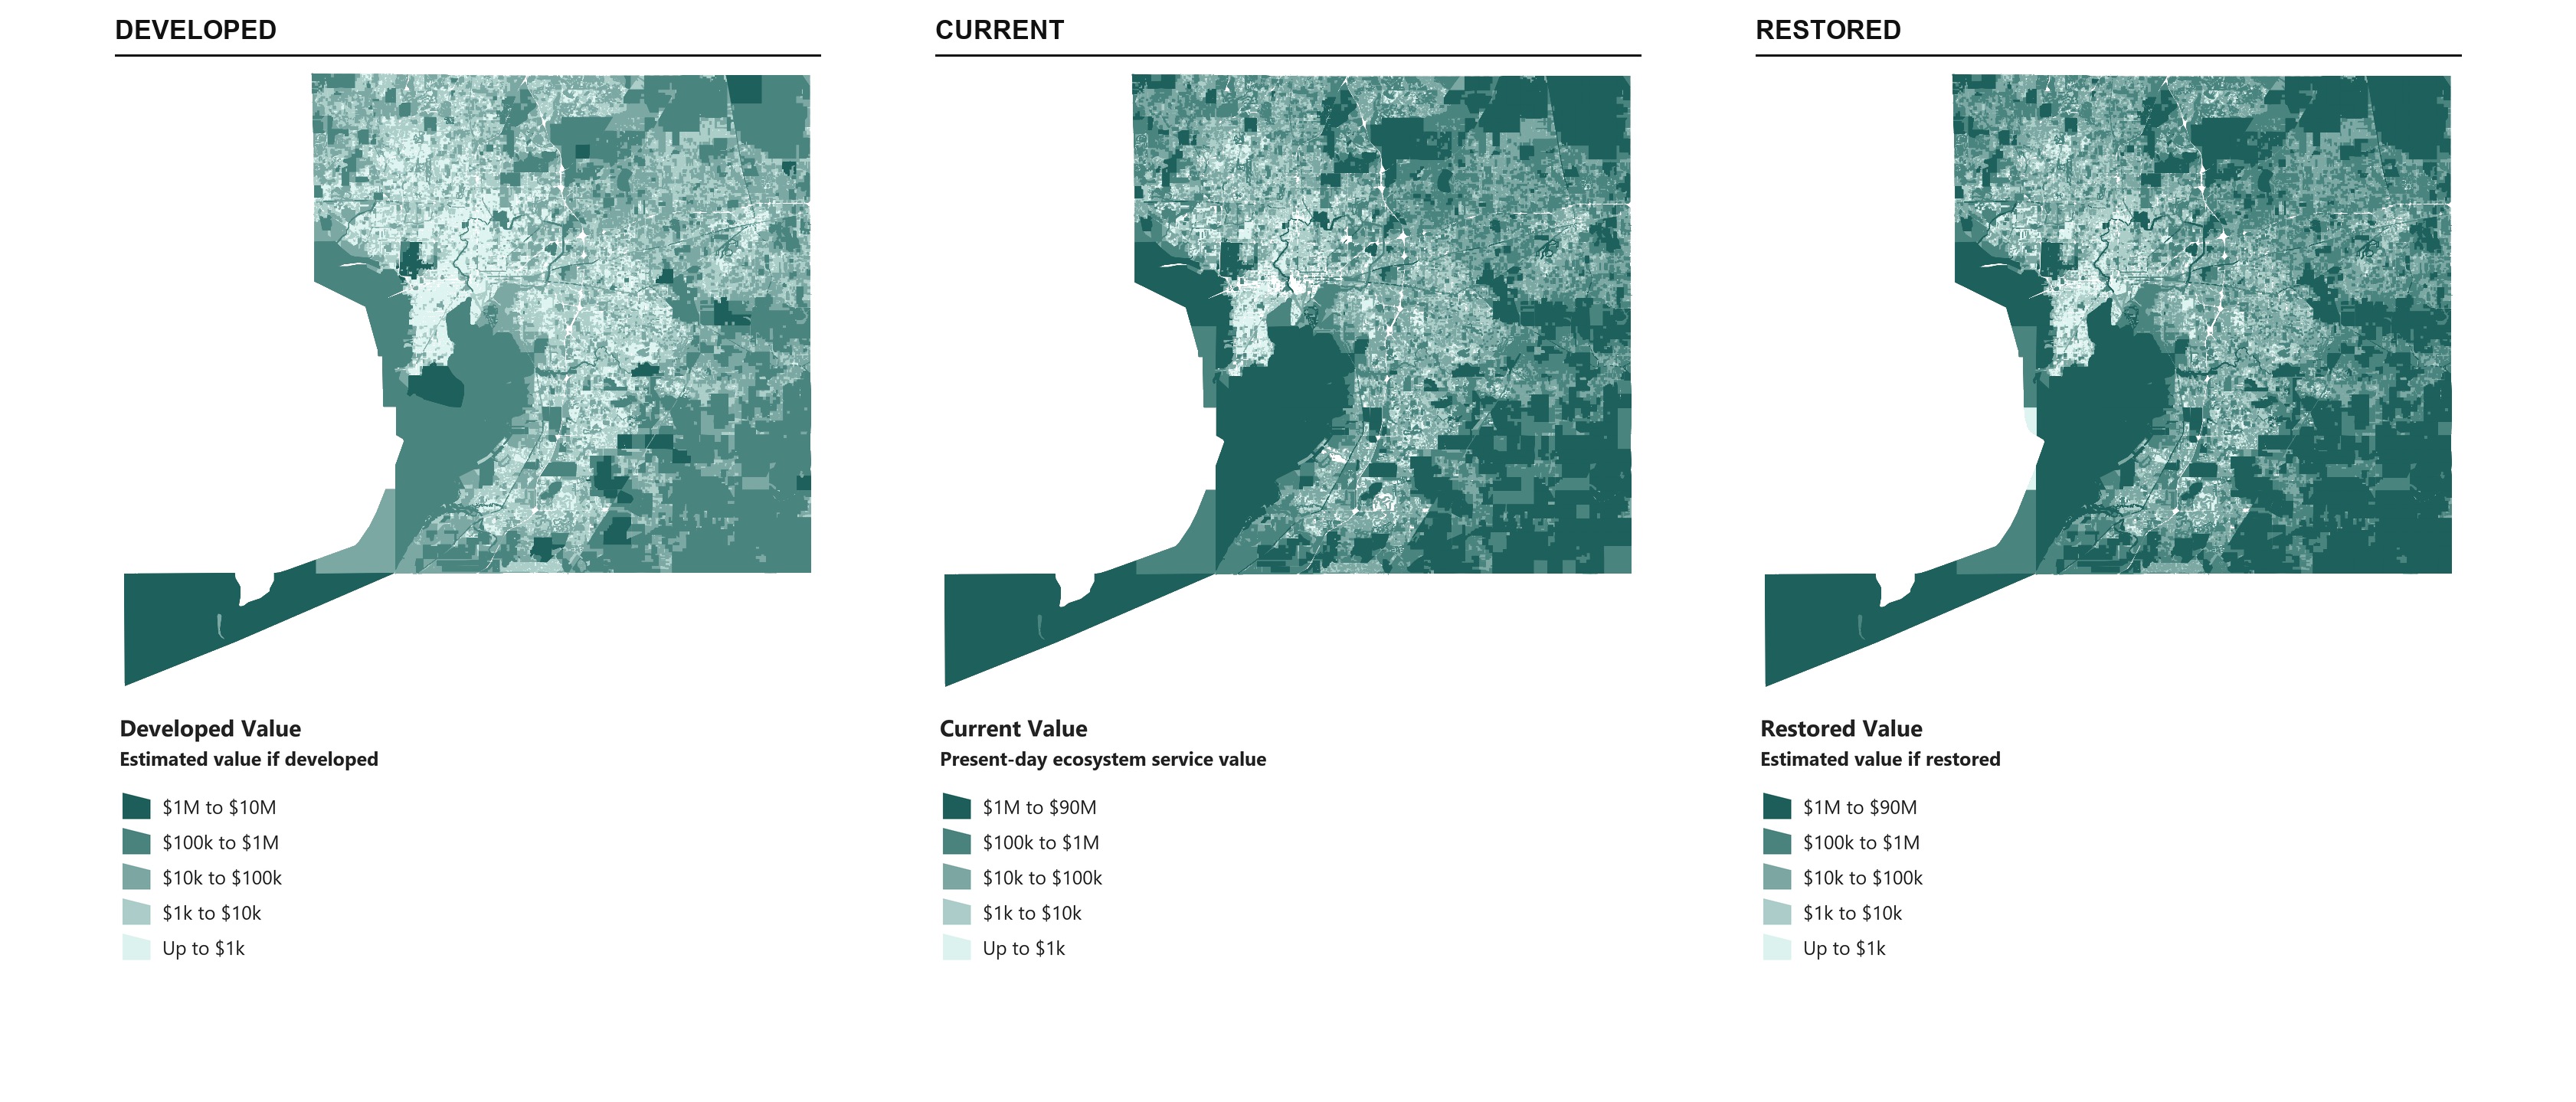
Land cover, soils, tree canopy and other environmental layers are intersected with parcel boundaries, so each parcel resolves into ecosystem types with acreages and per-service values. Each is compared across current and alternative land-cover scenarios, one fully developed and one restored.

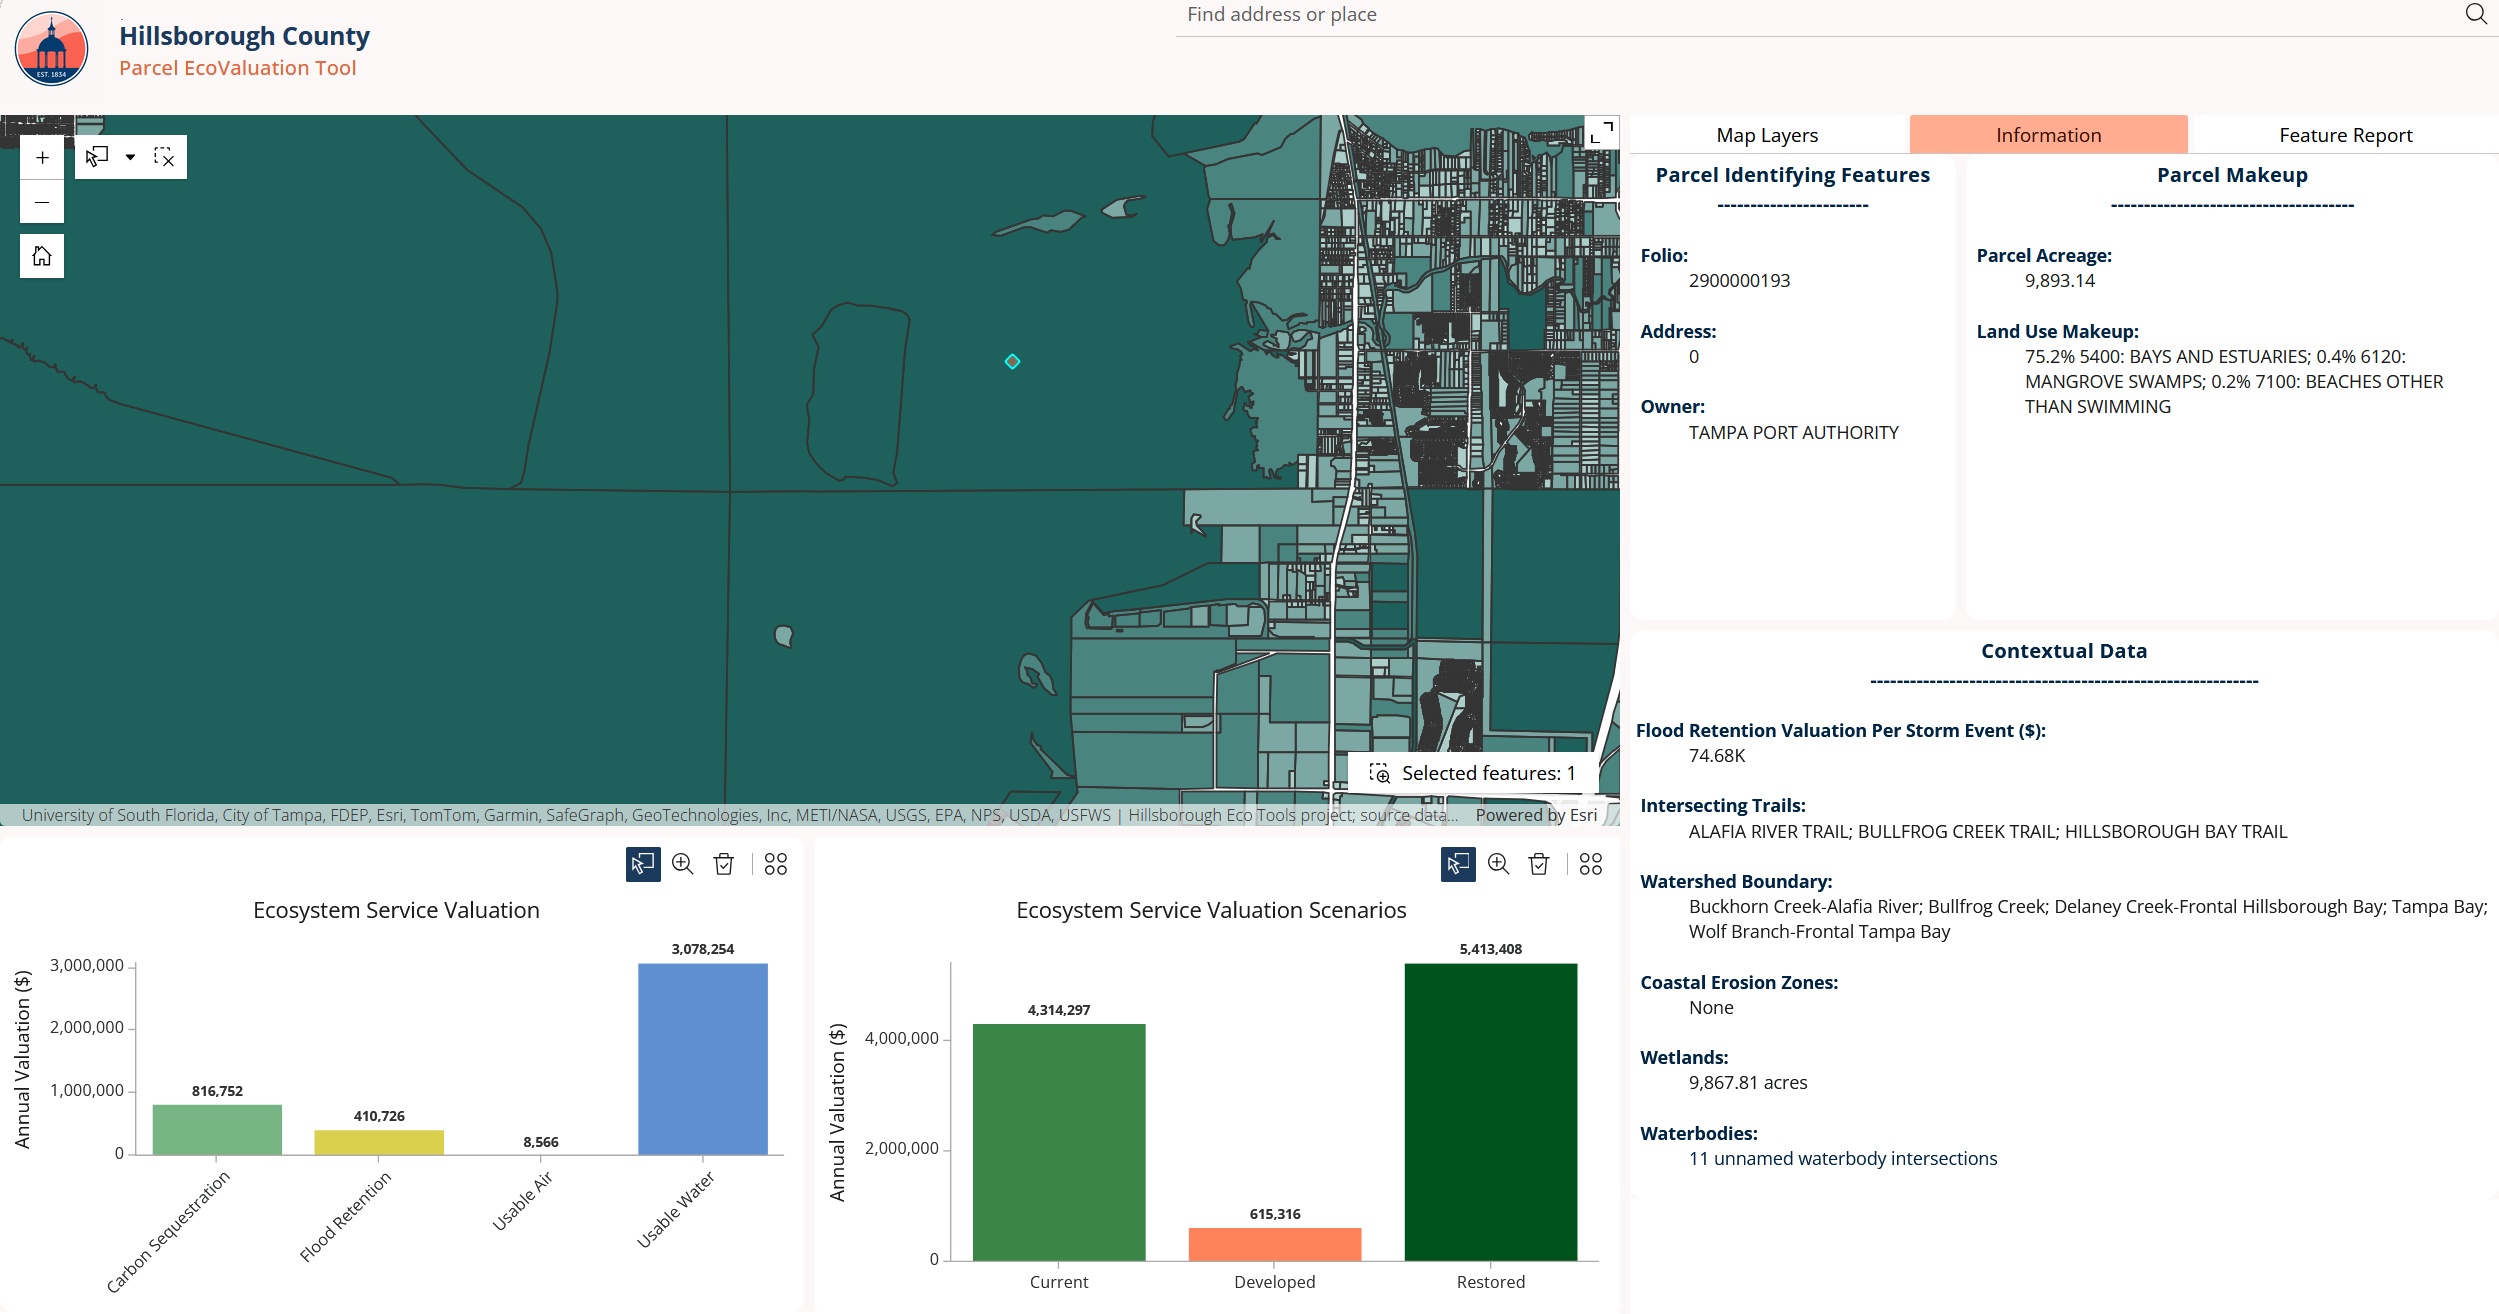
The analysis runs as a scripted ArcGIS Pro toolbox in Python. A configuration table drives data sources and publishing, so annual refreshes need no code changes, and a dry-run mode previews every publish. Results are delivered through a web application where selecting a parcel updates its land-use makeup and a chart of service values by scenario. Cached vector tiles keep a map of more than 500,000 parcels responsive.

Authorship: I am first author, with Dr. Kotryna Klizentyte (University of Florida) as second author.

My contribution: I built the analysis pipeline and ArcGIS Pro toolbox and delivered the results through the web application. I also wrote the operations guide and parcel report templates that let County staff refresh the data and produce reports on their own.
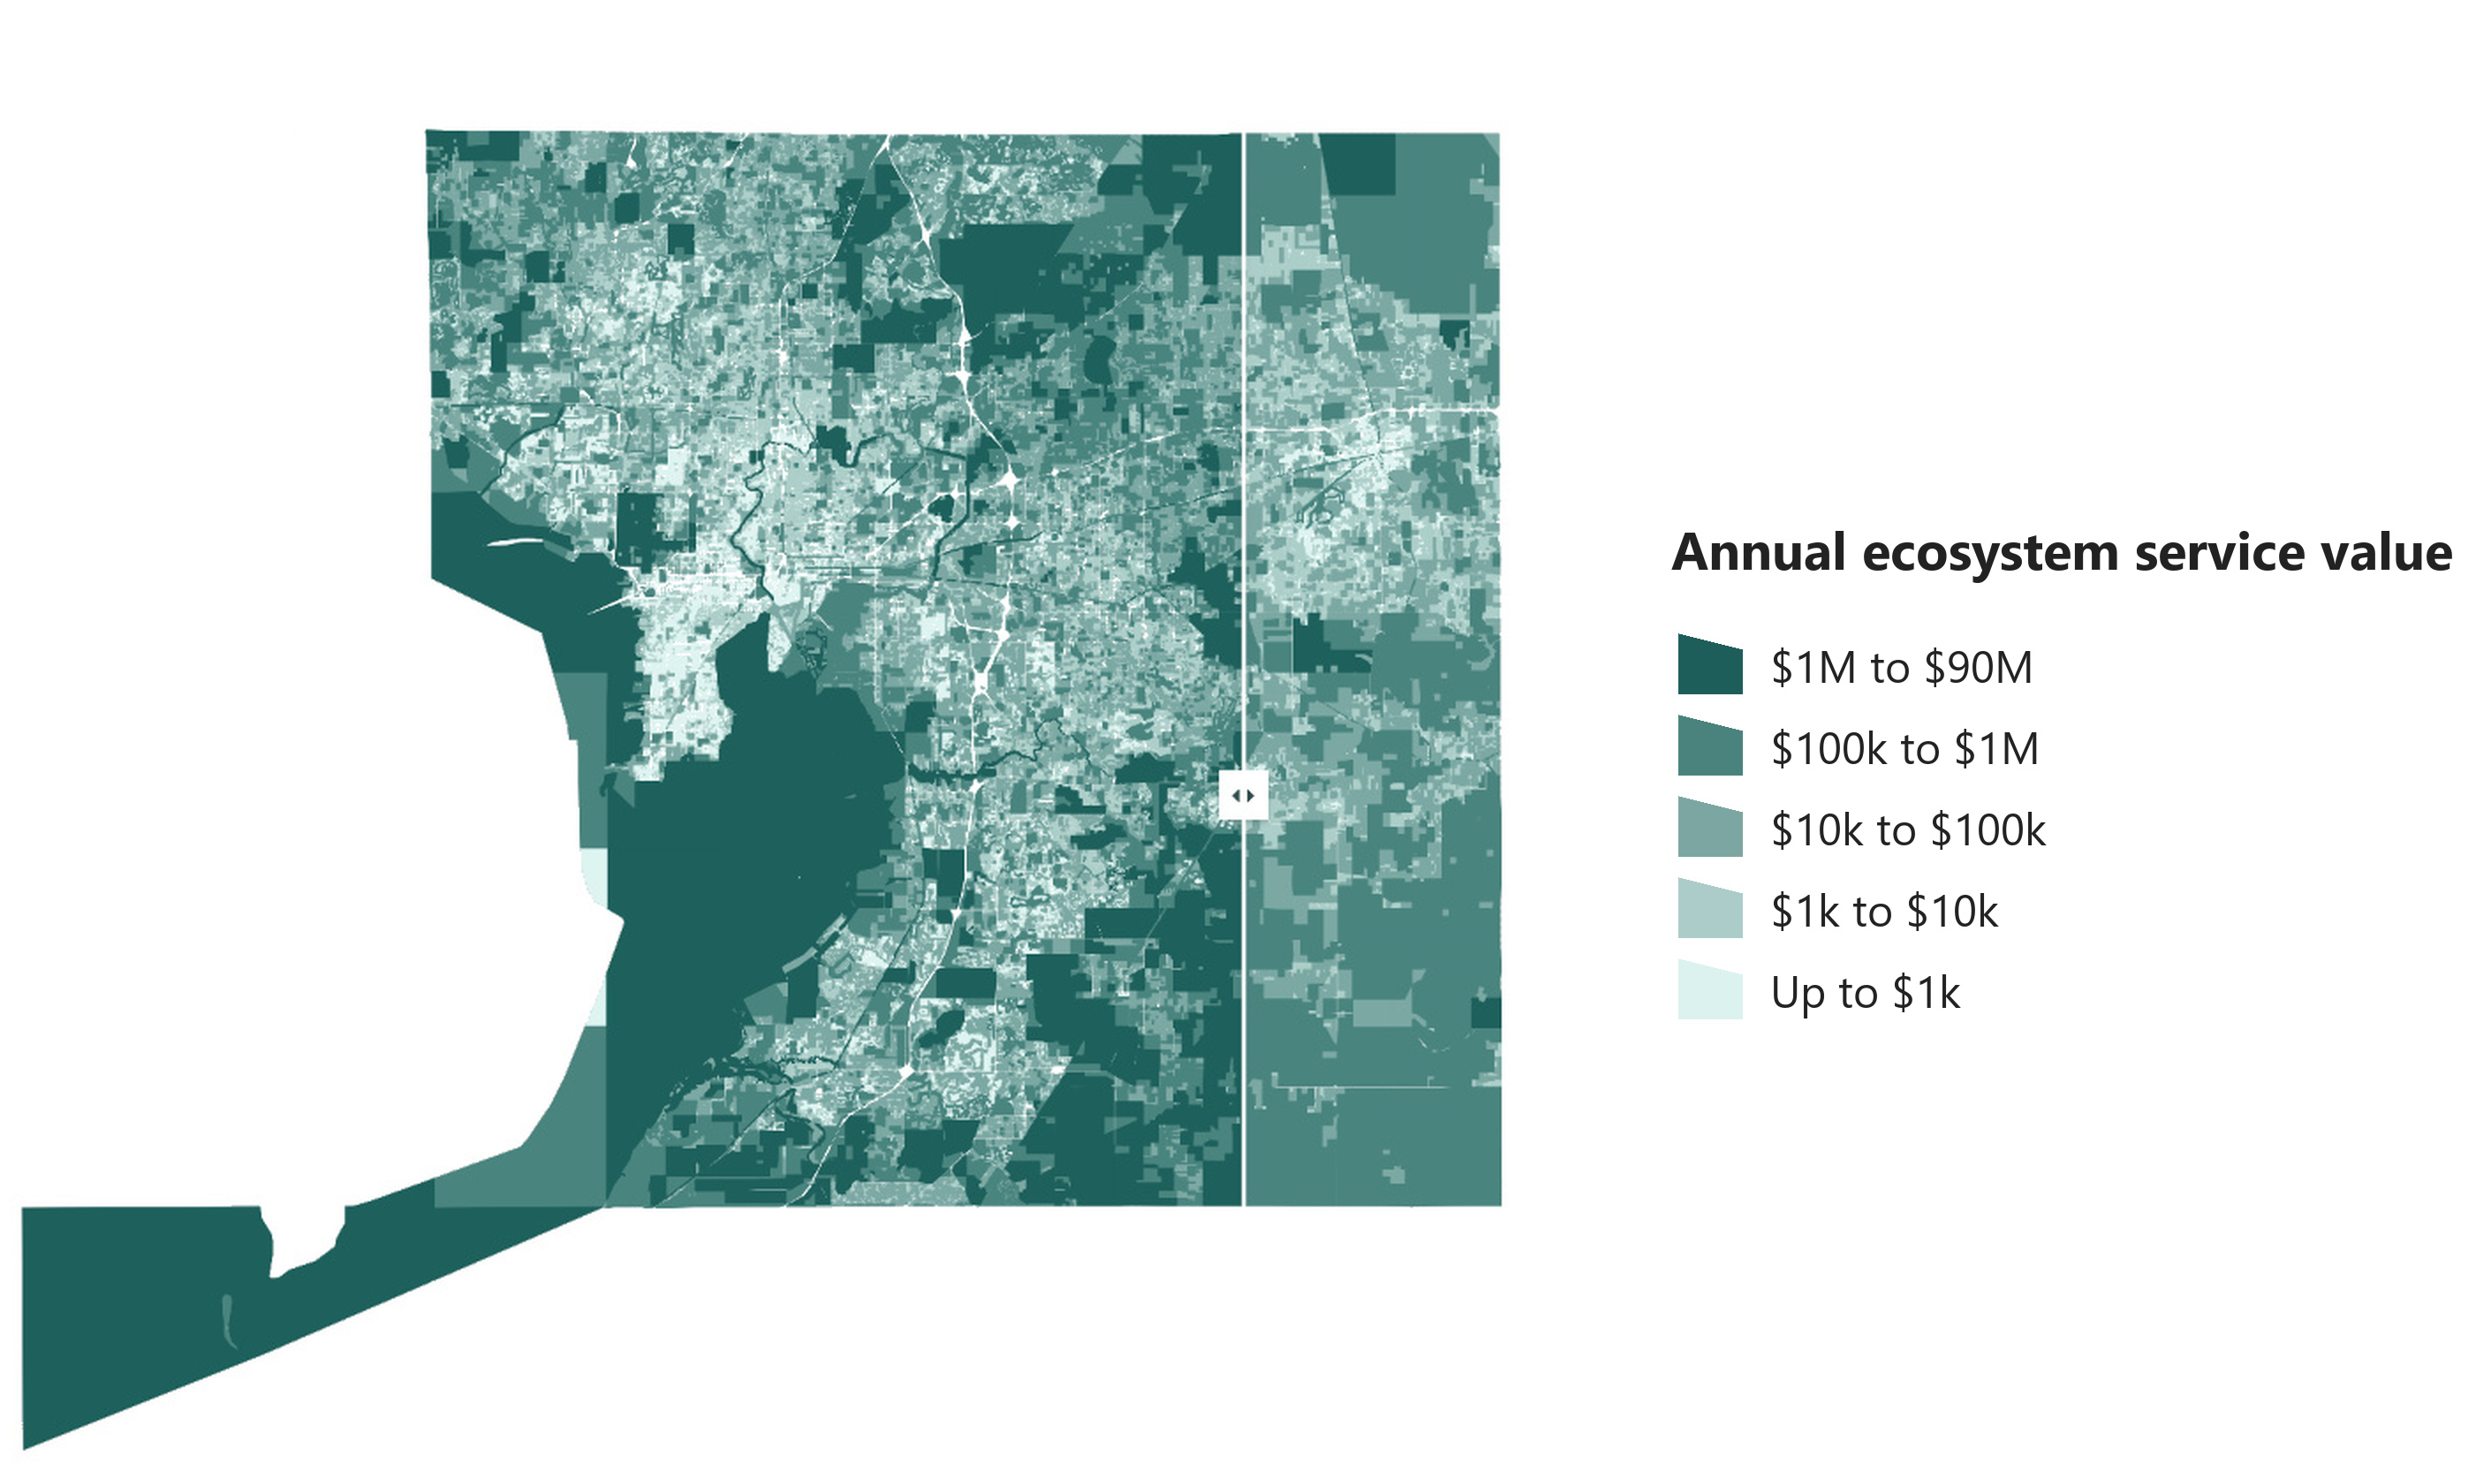
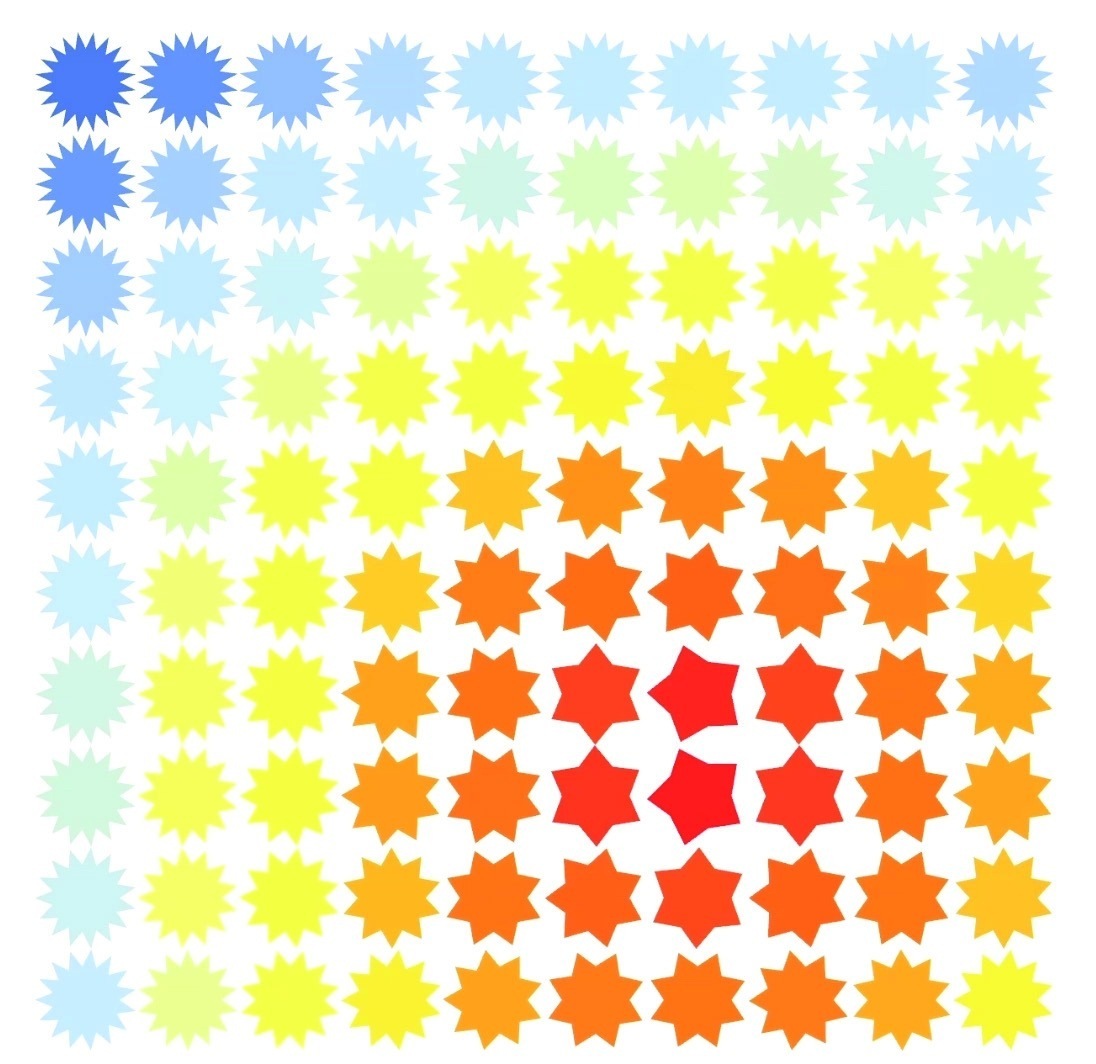
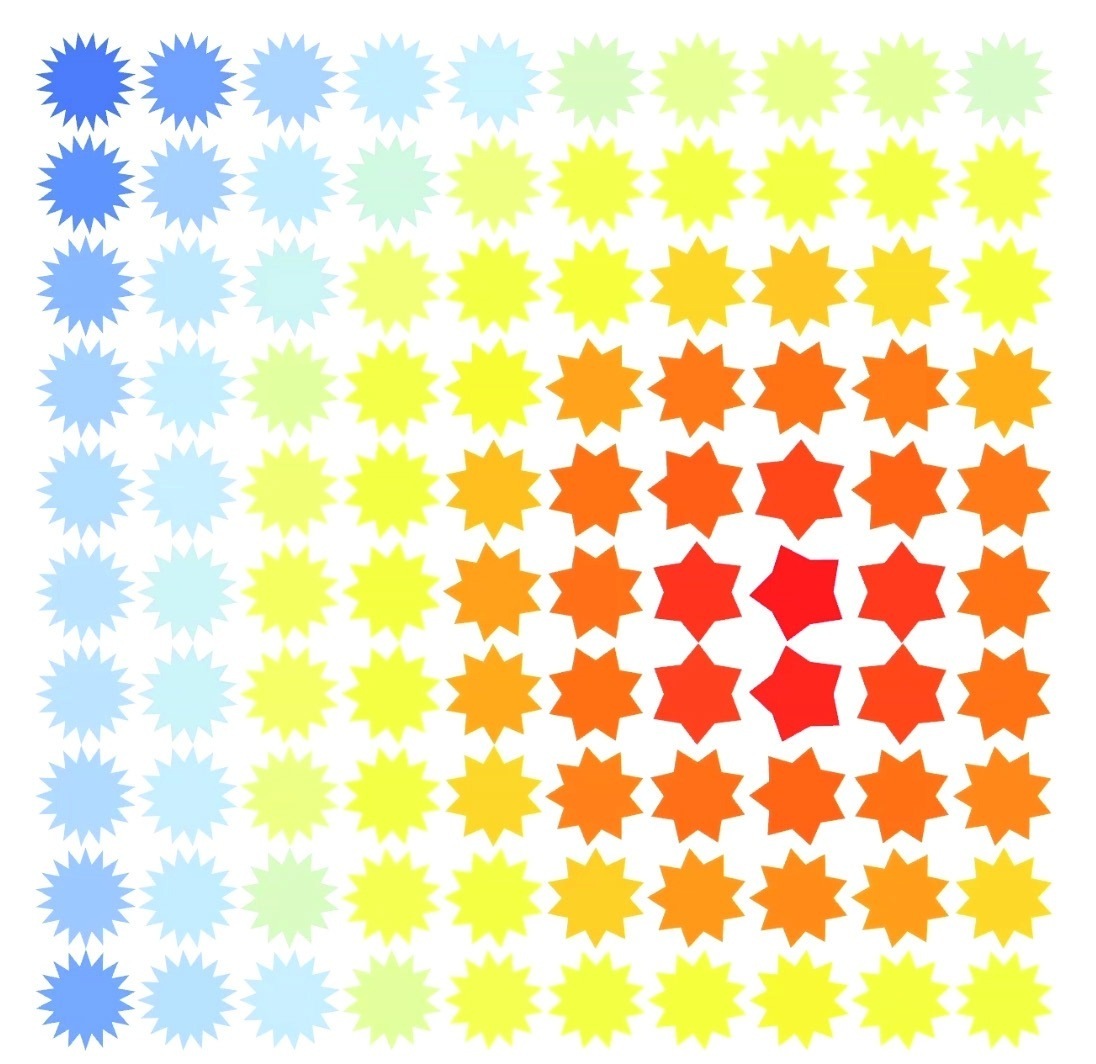
Countywide ecosystem service value, current (left) and fully developed (right)CurrentDeveloped
Countywide value, current conditions (left) vs. fully developed scenario (right)
Ecosystem service layers in the web application, shown by parcel
Annual ecosystem service value under three land-cover scenarios
The Parcel EcoValuation web application: selecting a parcel updates its makeup and value charts
02

Agents of Biodiversity

Year
Fall 2025
Status
Proposal: concept and diagram, not built
Type
Adaptive green infrastructure
Location
Pittsburgh, PA
Focus
Bioswales, flood risk, sensing

A proposal for bioswale modules that report on their own health, so maintenance follows need instead of a calendar.

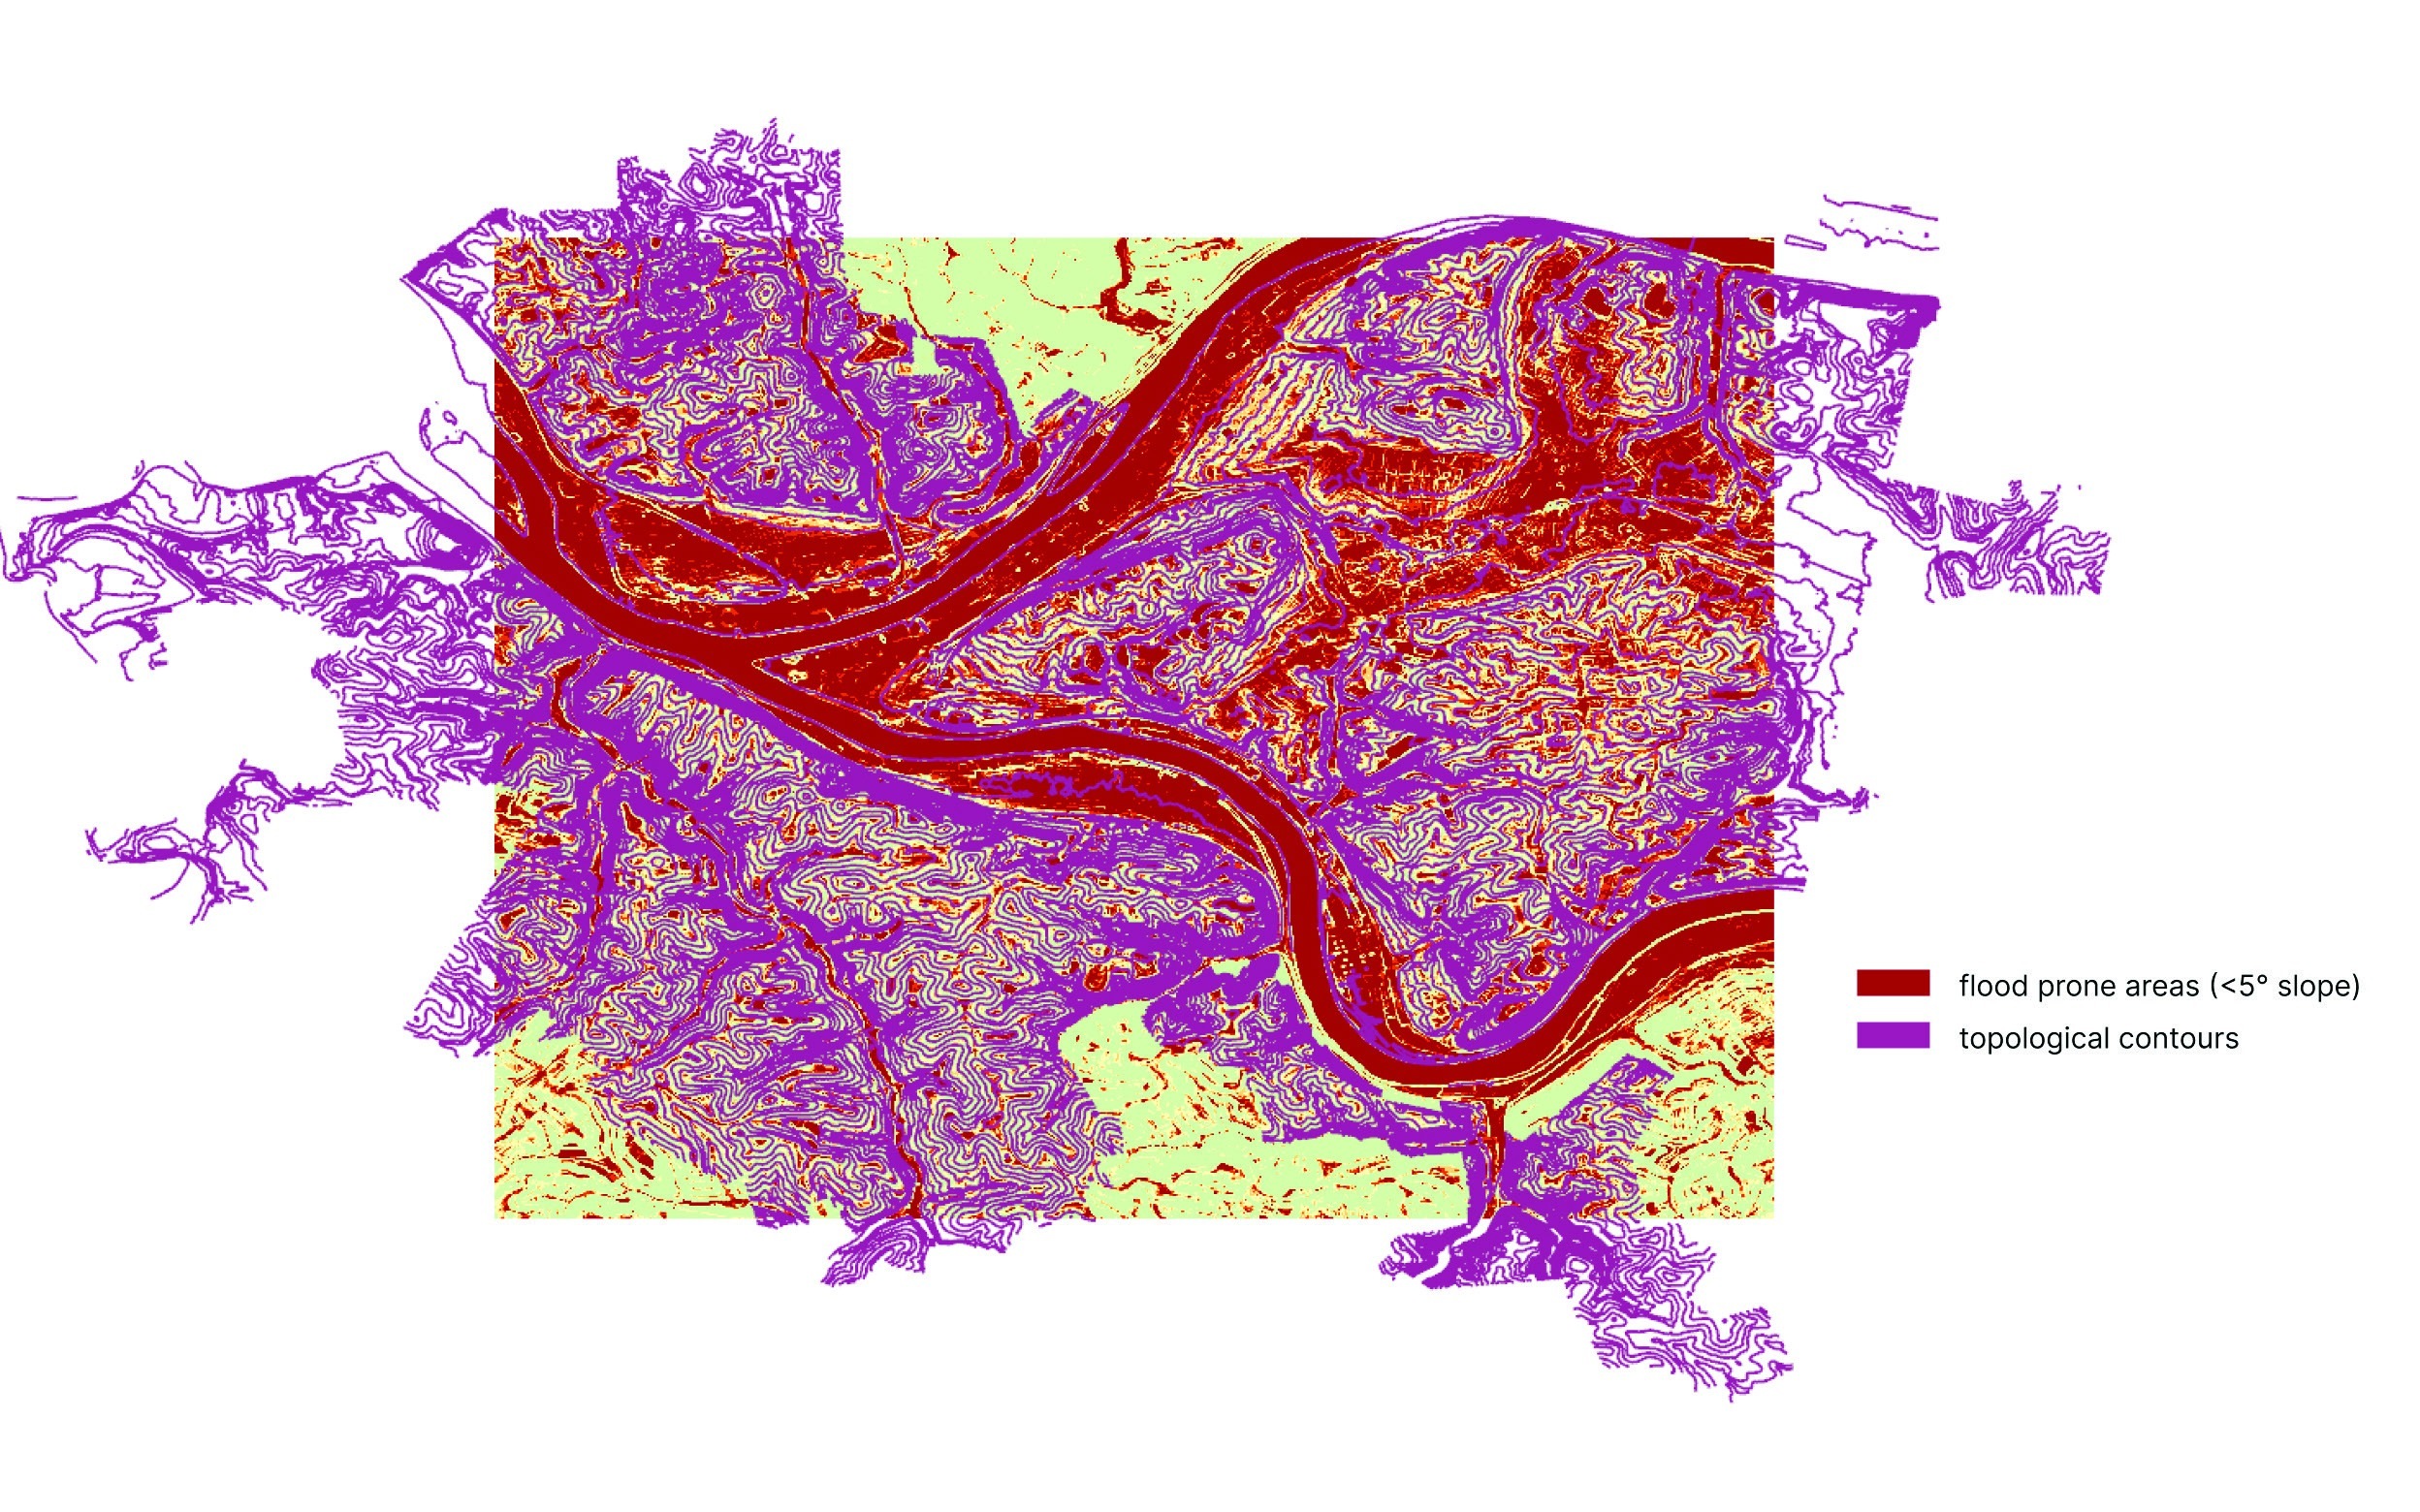
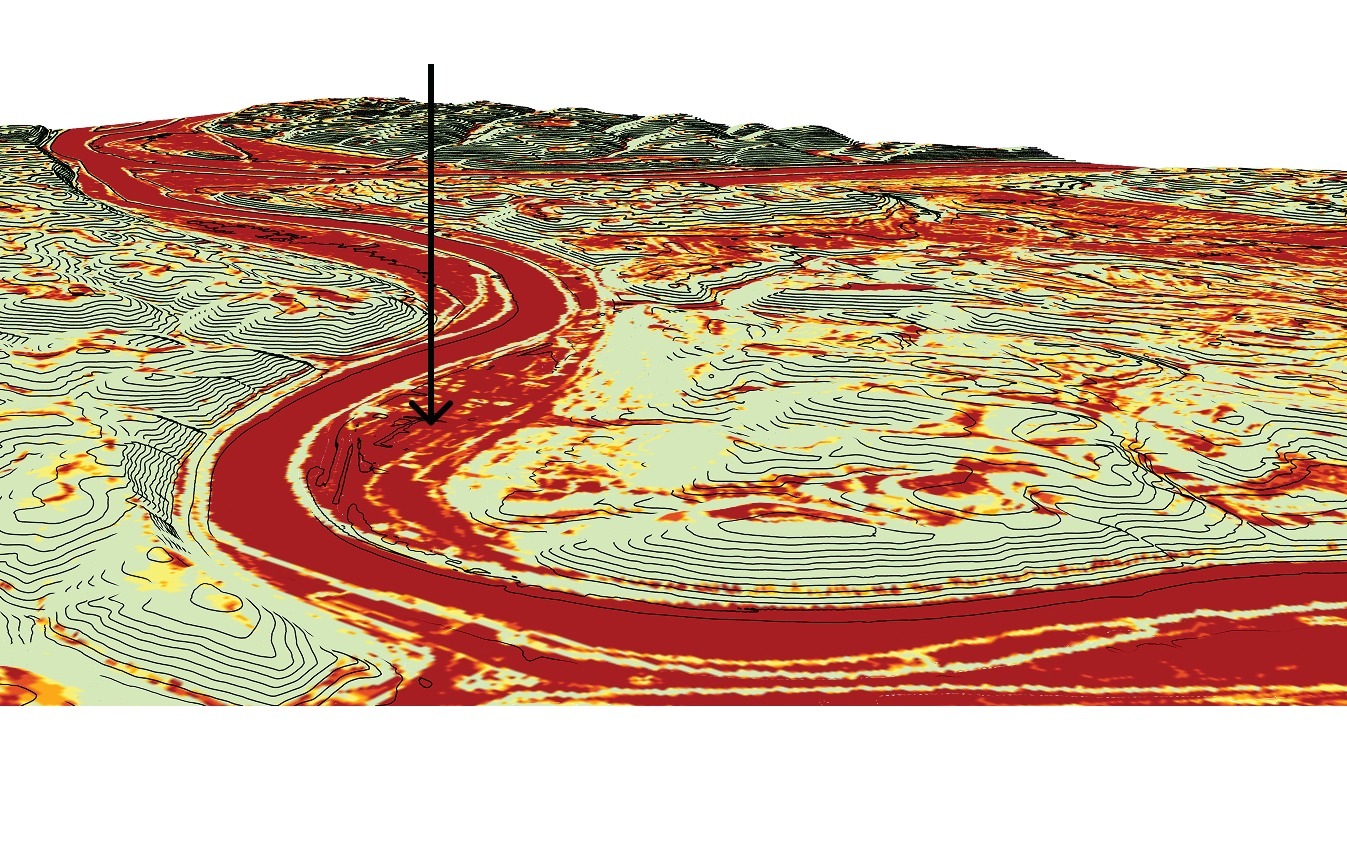
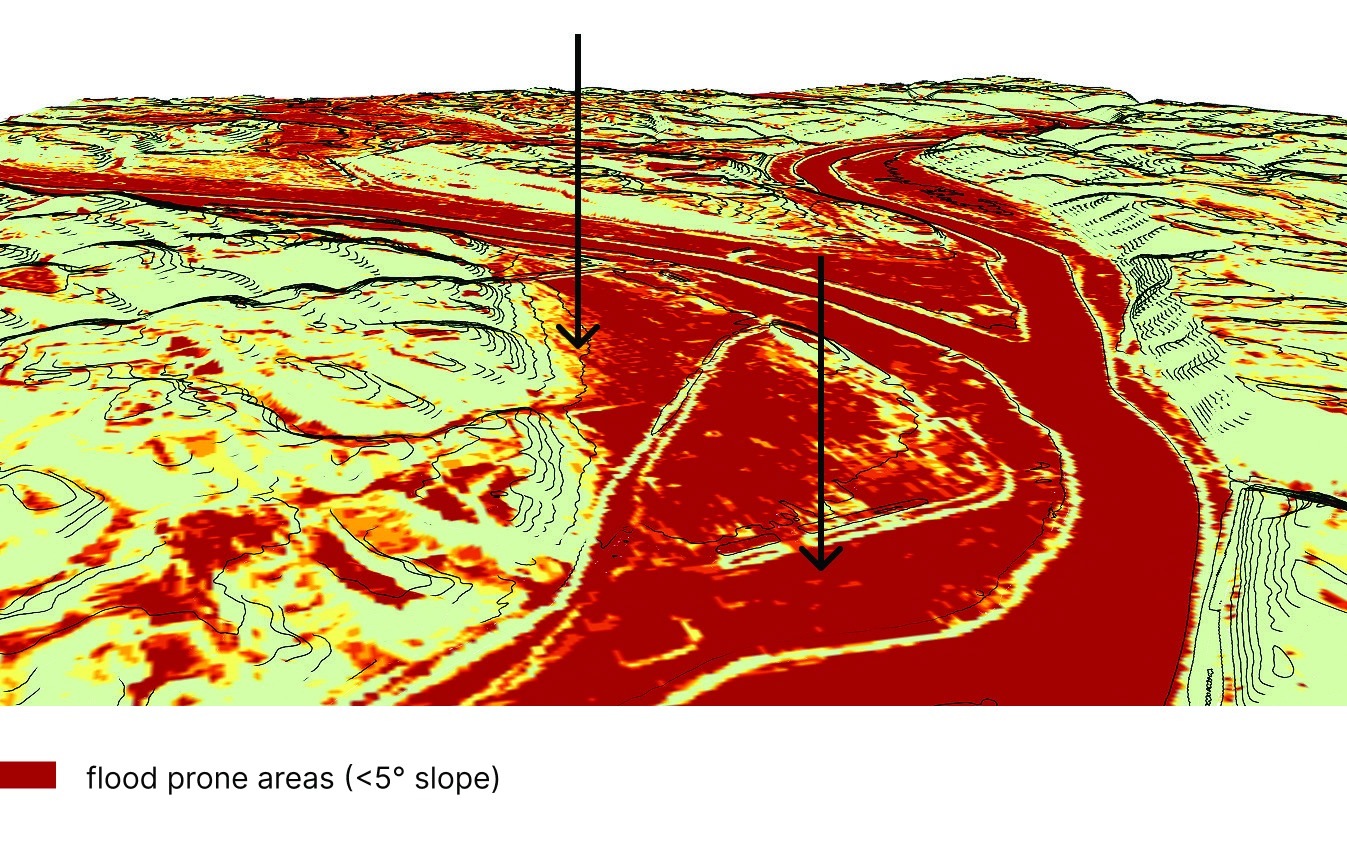
Pittsburgh’s steep topography and aging infrastructure, together with intensifying storms, raise flood risk. Bioswales improve infiltration and reduce runoff, but they demand upkeep and monitoring to keep performing.

This proposal suggests Adaptive Bioswale Modules in ceramic or bio-based composites that support biodiversity and nutrient cycling. A sensor interface tracks NPK and soil moisture, and site factors such as soil compaction and hill slope tune maintenance schedules, cutting unnecessary spending and extending the life of the urban waterscape.

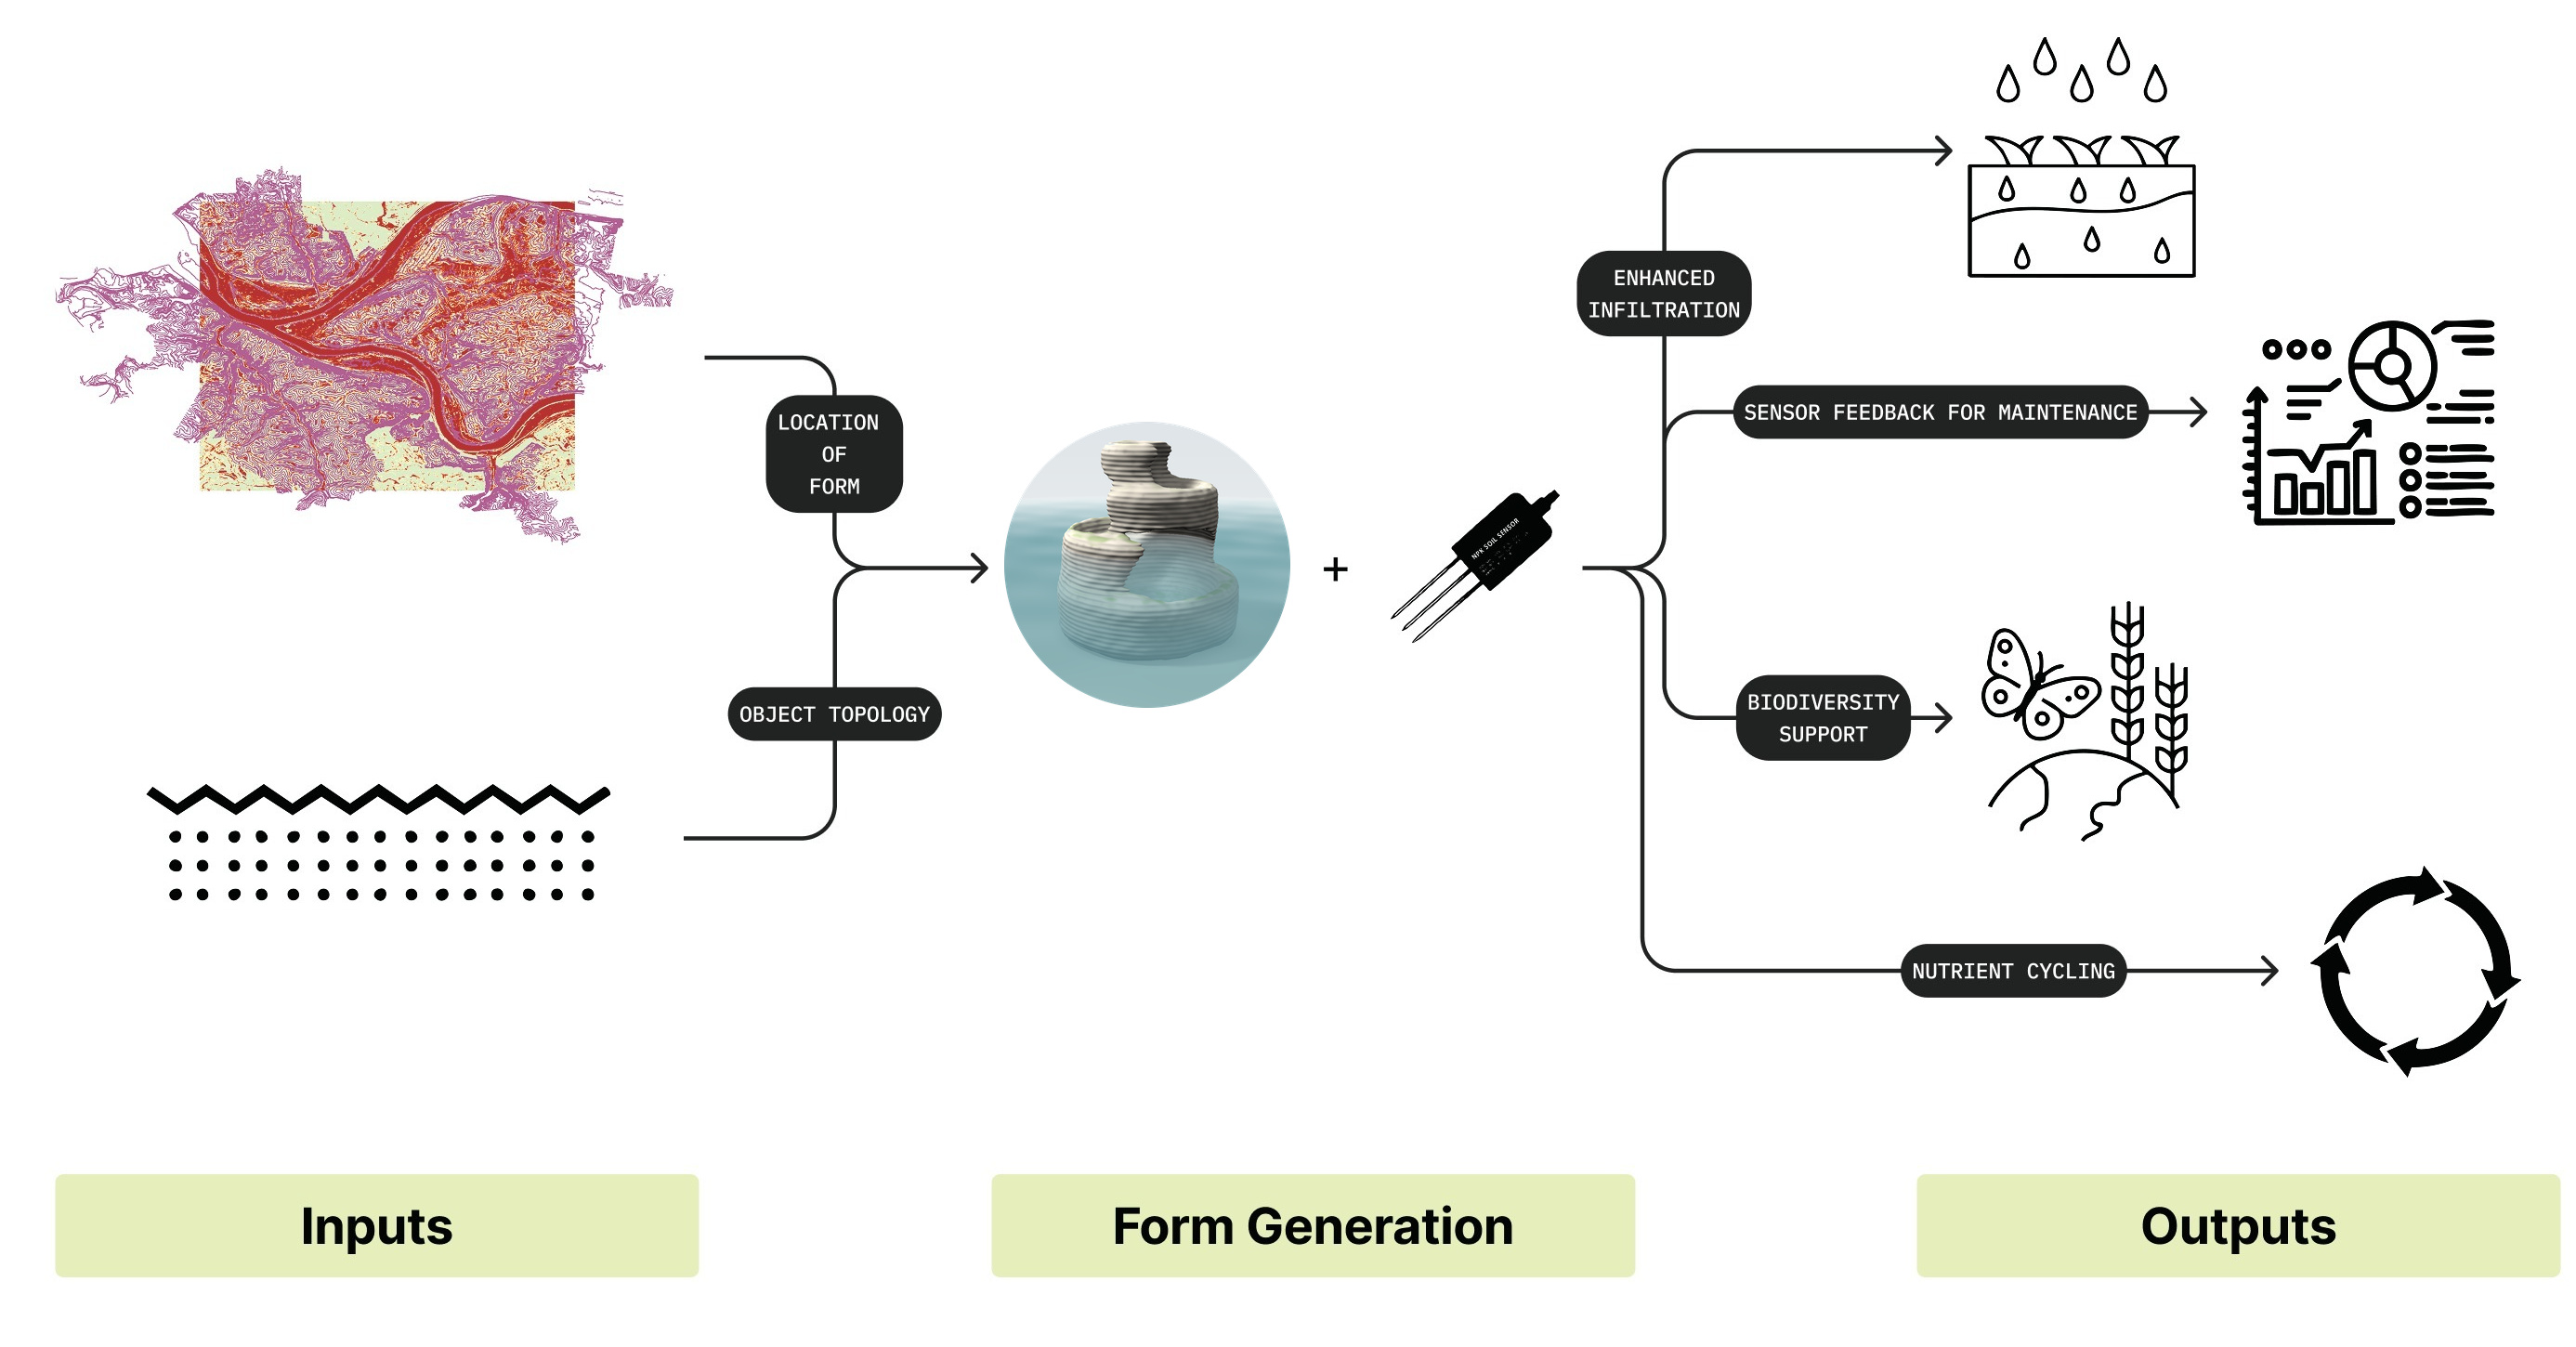
The diagram reads left to right. Two inputs, the location of the form on Pittsburgh’s slope and flood data and the topology of the object, feed the form generation, and the module is paired with a soil sensor. The outcomes are better infiltration and sensor feedback for maintenance, plus support for biodiversity and nutrient cycling. The printed form and sensor node continue in my thesis work.

Inputs, form generation, outputs
Flood-prone areas (<5° slope) and topographic contours
Flood-prone terrain
Flood-prone terrain
Flood-prone terrain, river bend
03

Reimagining Aqua Tower

Year
Fall 2025
Type
Climate redesign, high-rise
Location
San Diego, CA (zone 3B)
Collaborators
Kruti Makwana, Aashritha Jaladi, Julia Twardzisz
My role
Environmental simulation; remapped floor plates to solar radiation
A Chicago icon translated to a Pacific presence: a cascading tower shaped by wind, sun and view.
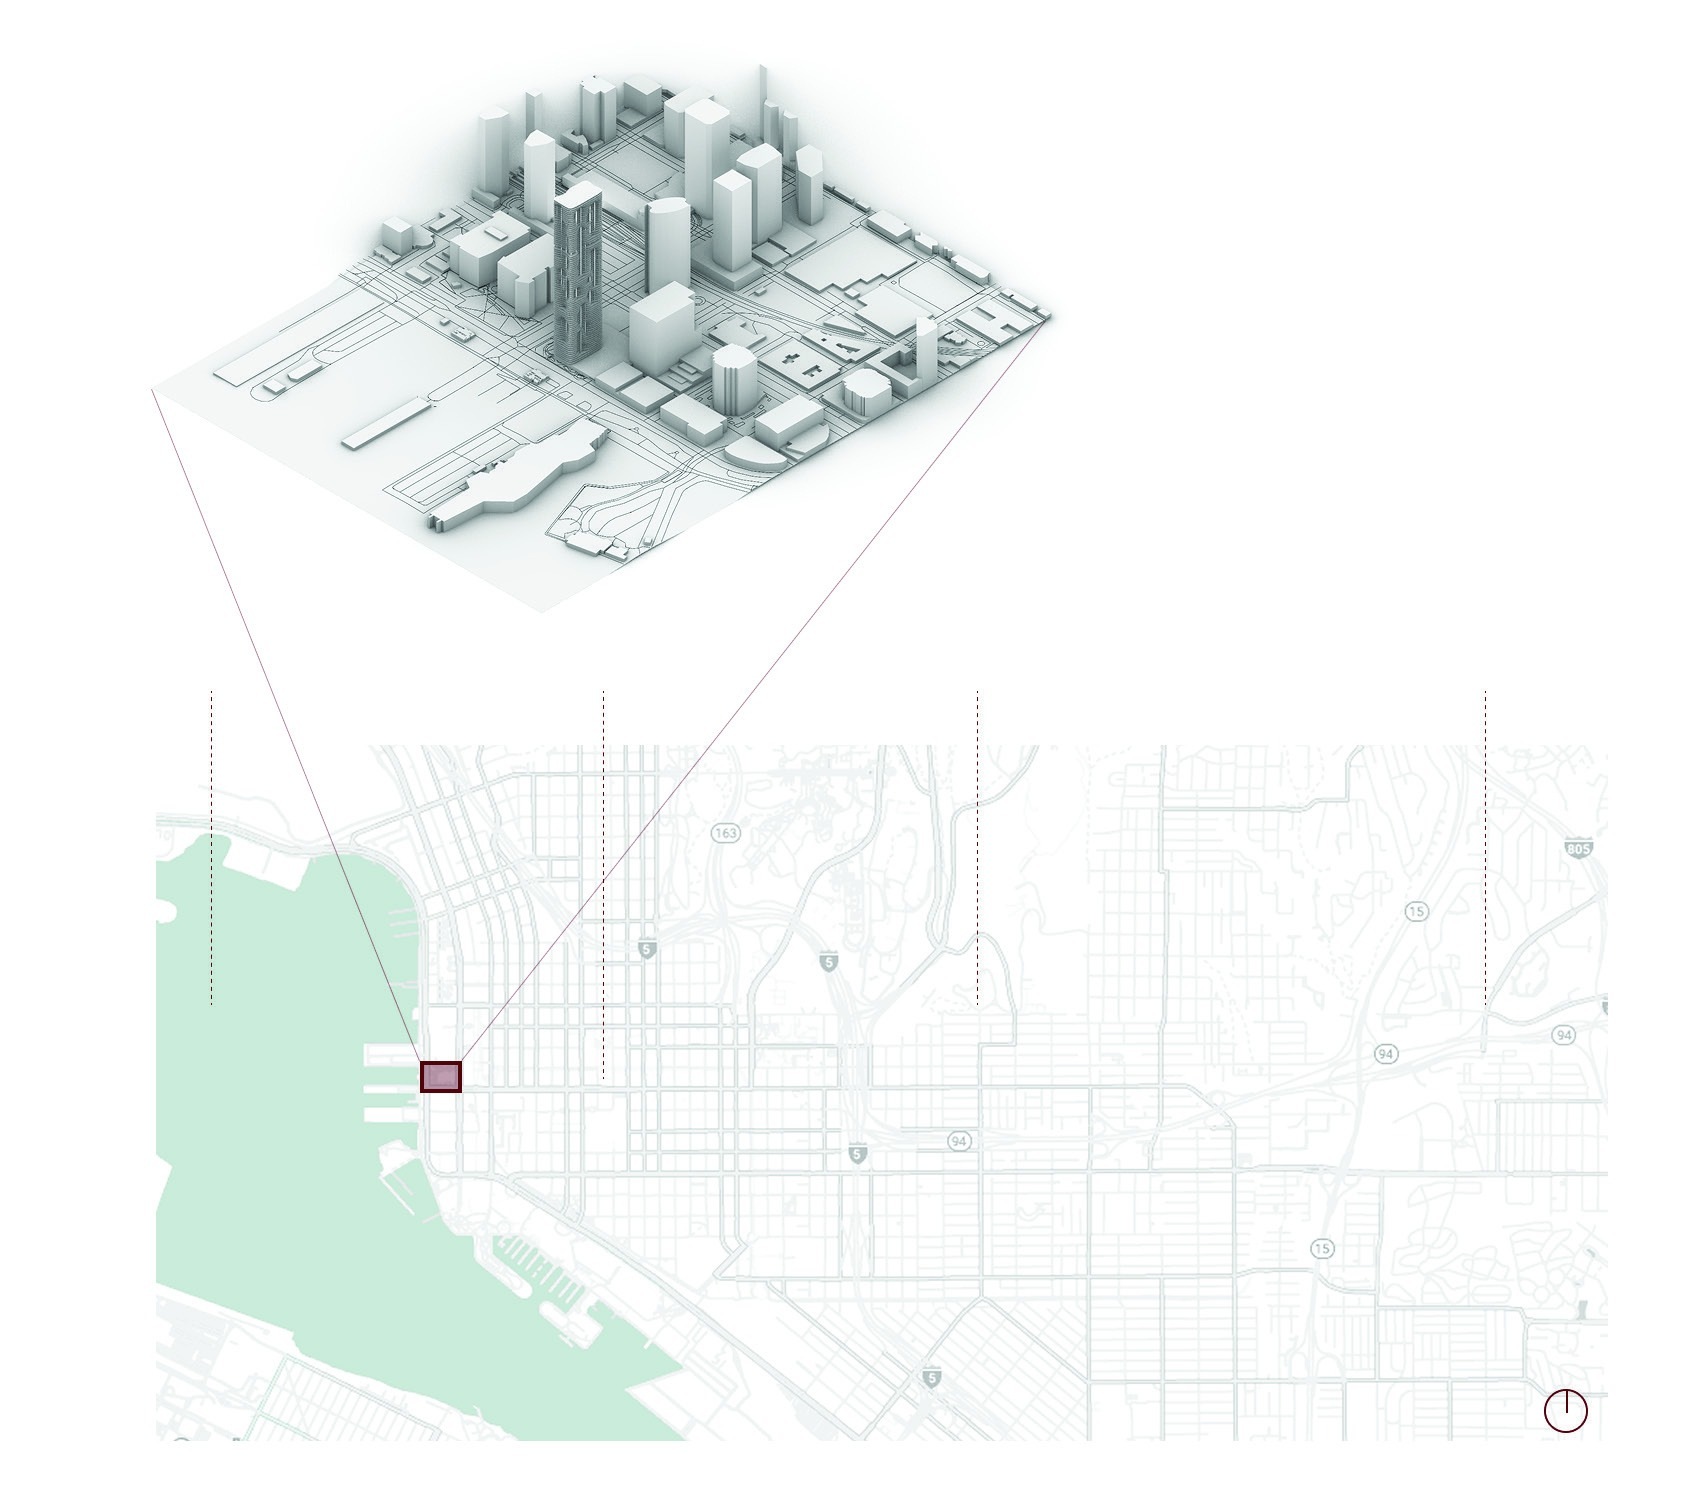
The project moves Chicago’s Aqua Tower into San Diego’s warm marine climate, in the Central Building District along the bay. Natural ventilation and cooling take priority to reduce thermal stress.

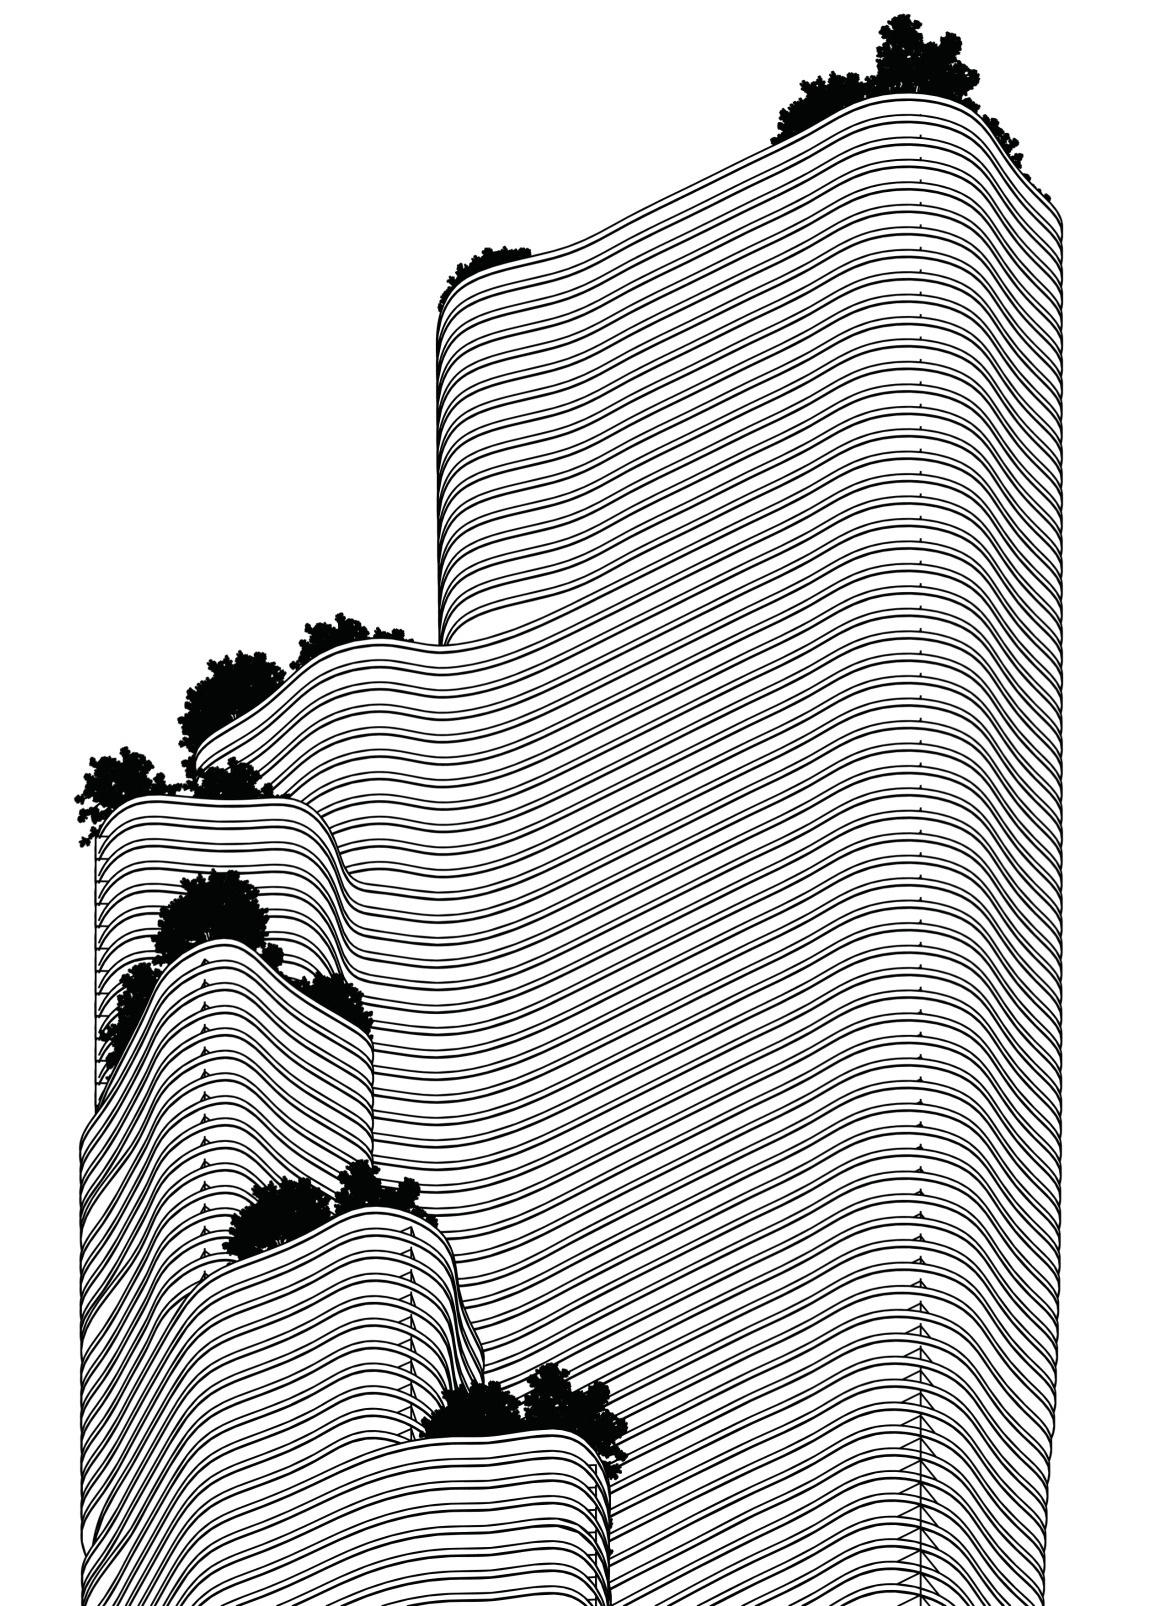
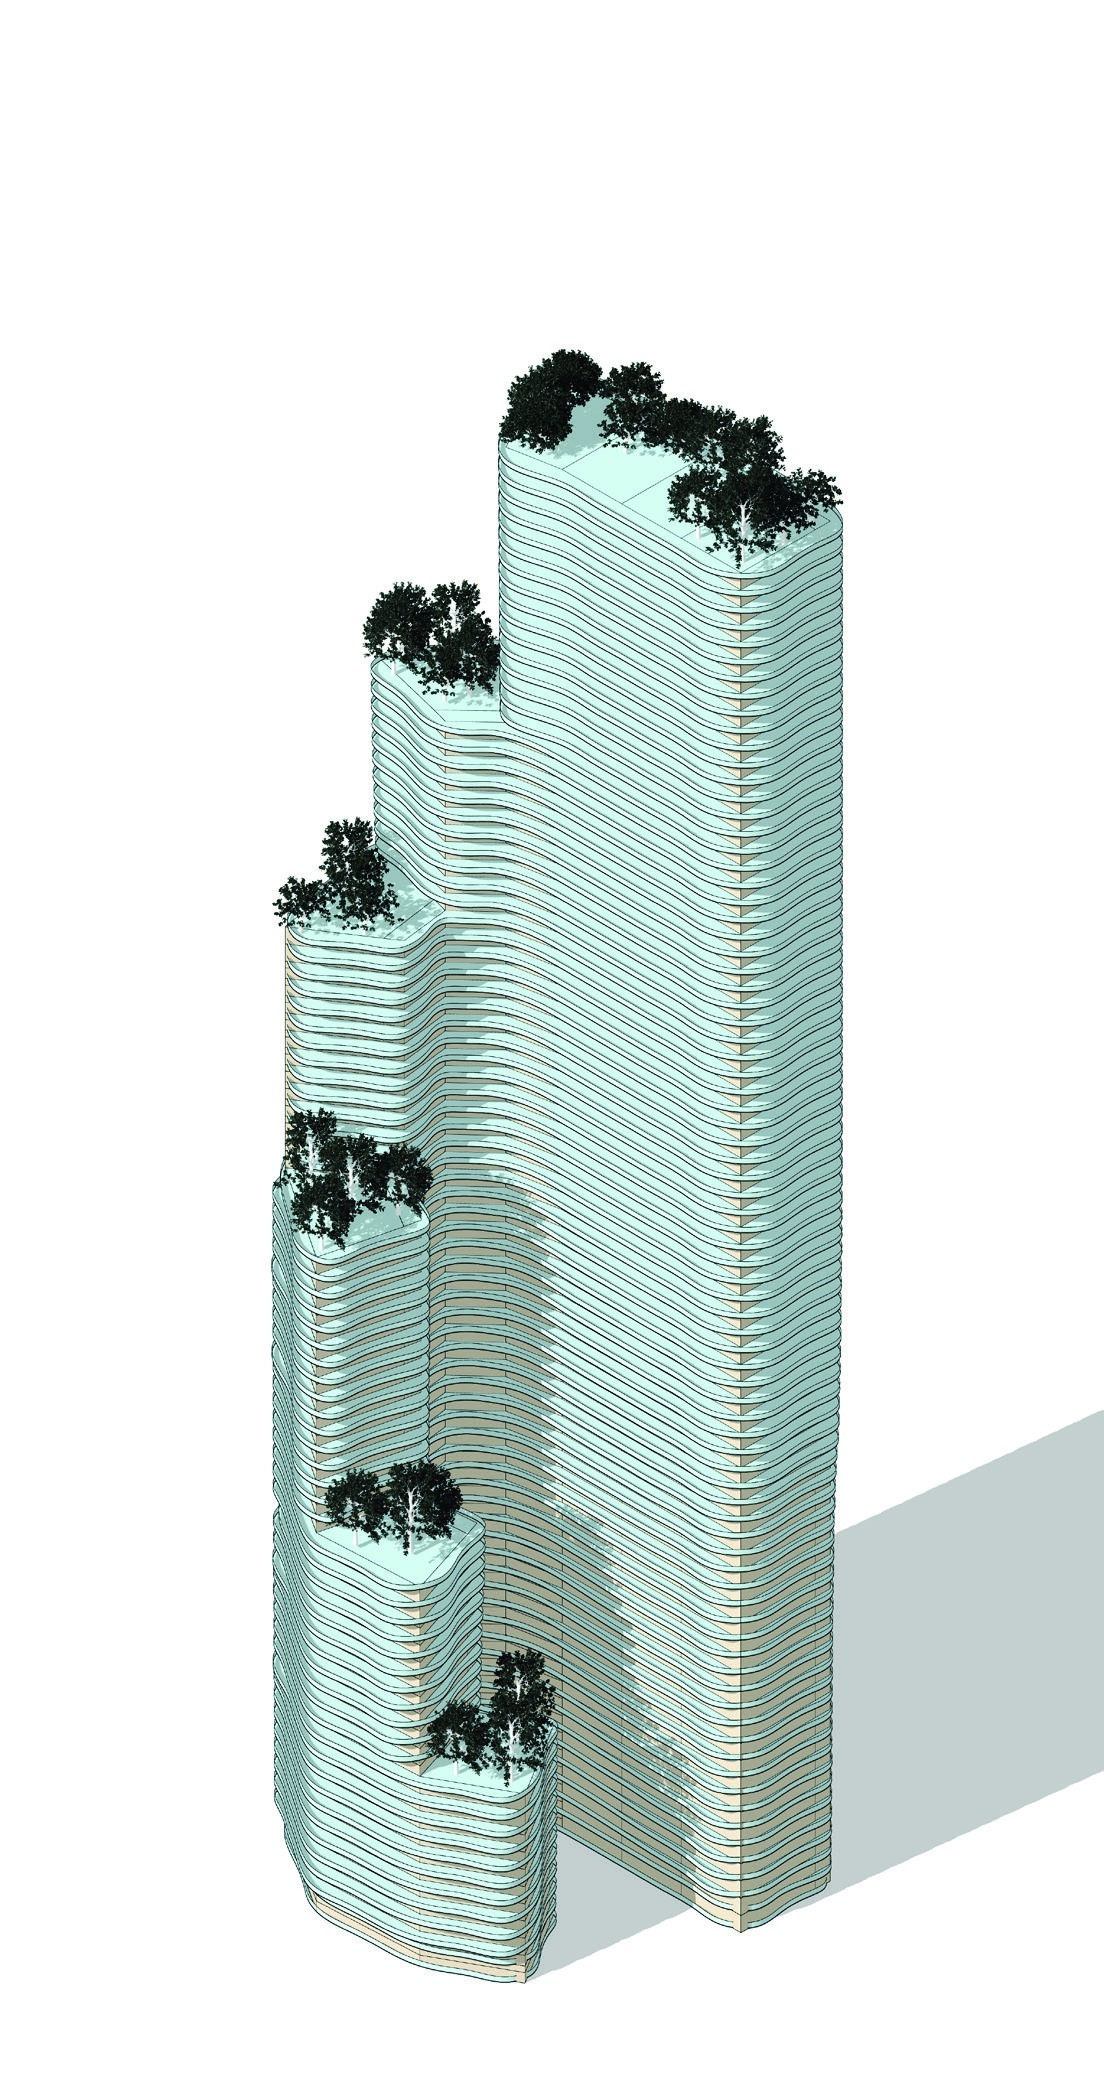
A staggered form, modeled after waves and terrestrial contours, carries green terraces and roof gardens that support community connection. Units use parallel windows to draw cross ventilation from prevailing western winds while capturing views of the Pacific and Balboa Park.

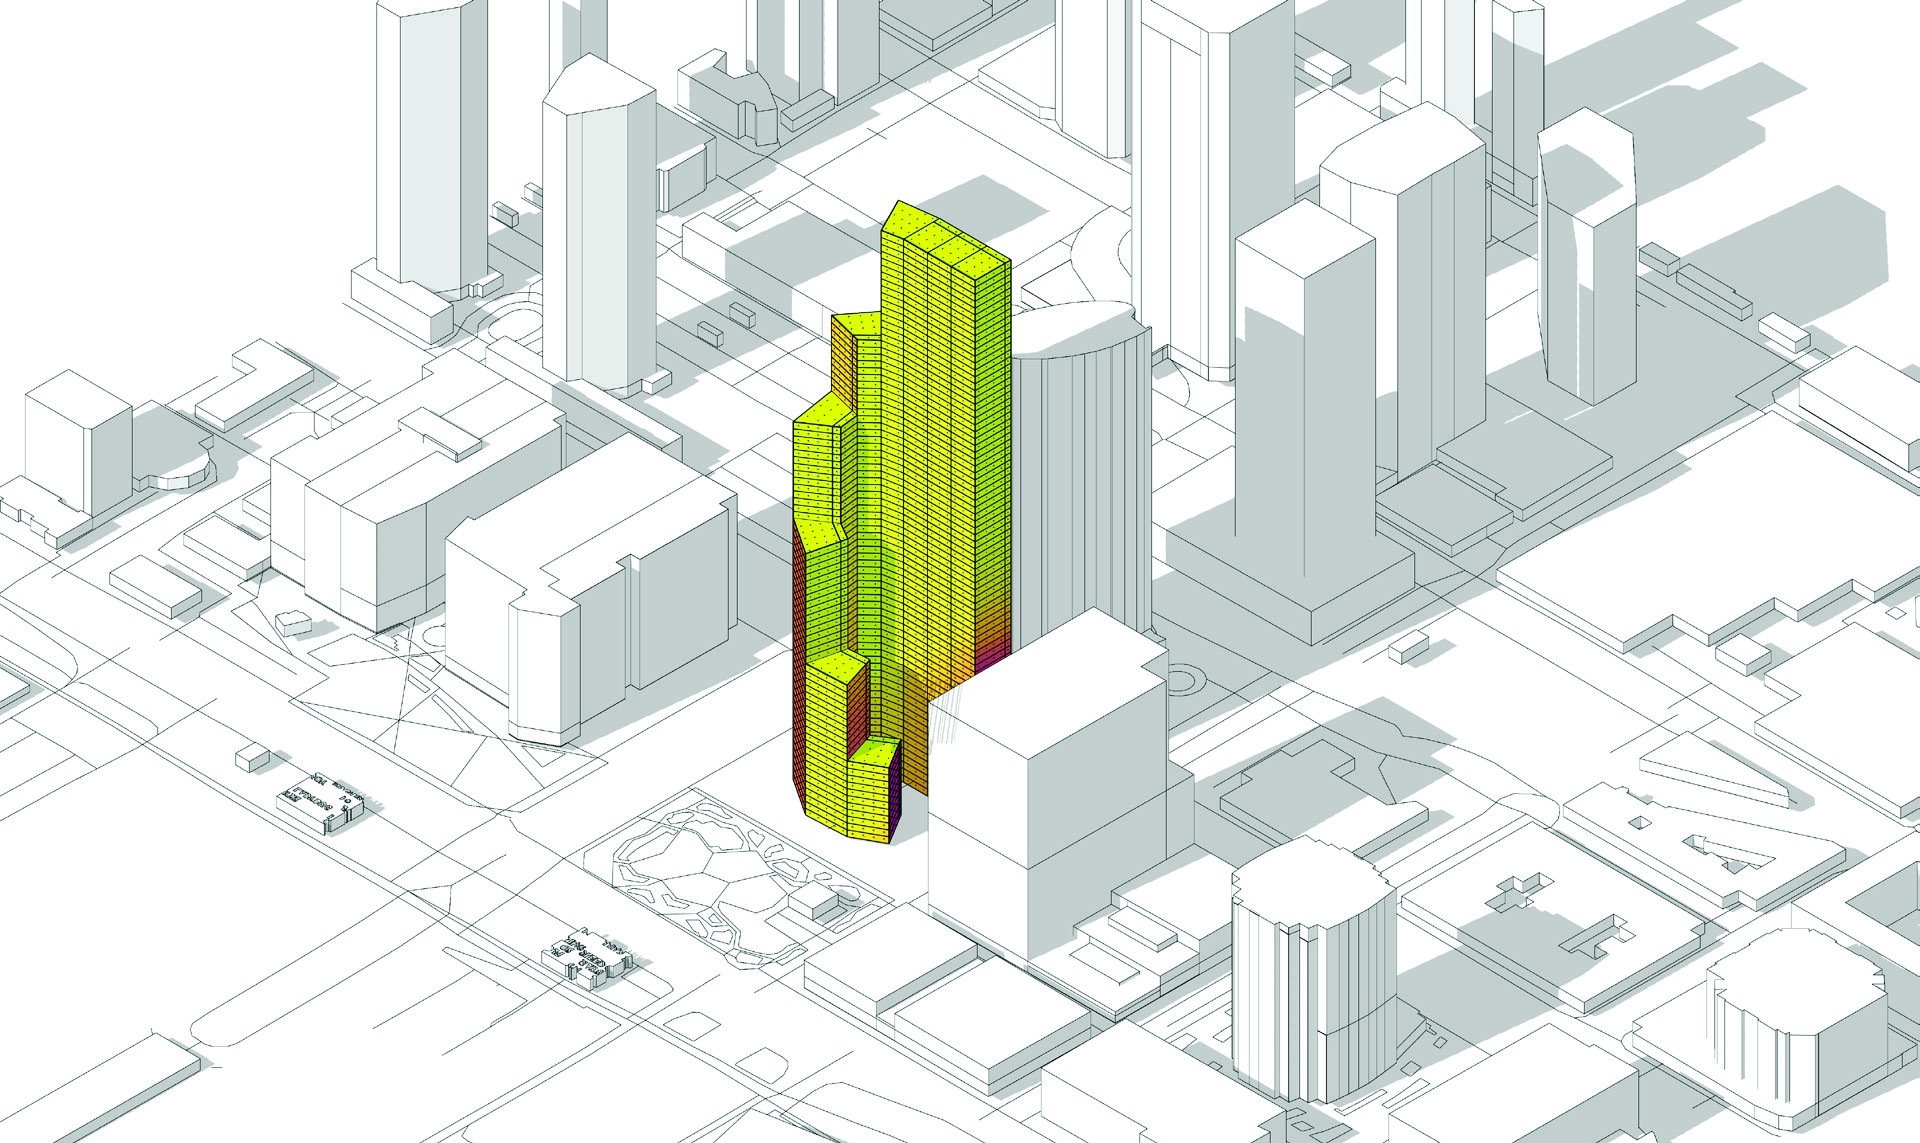
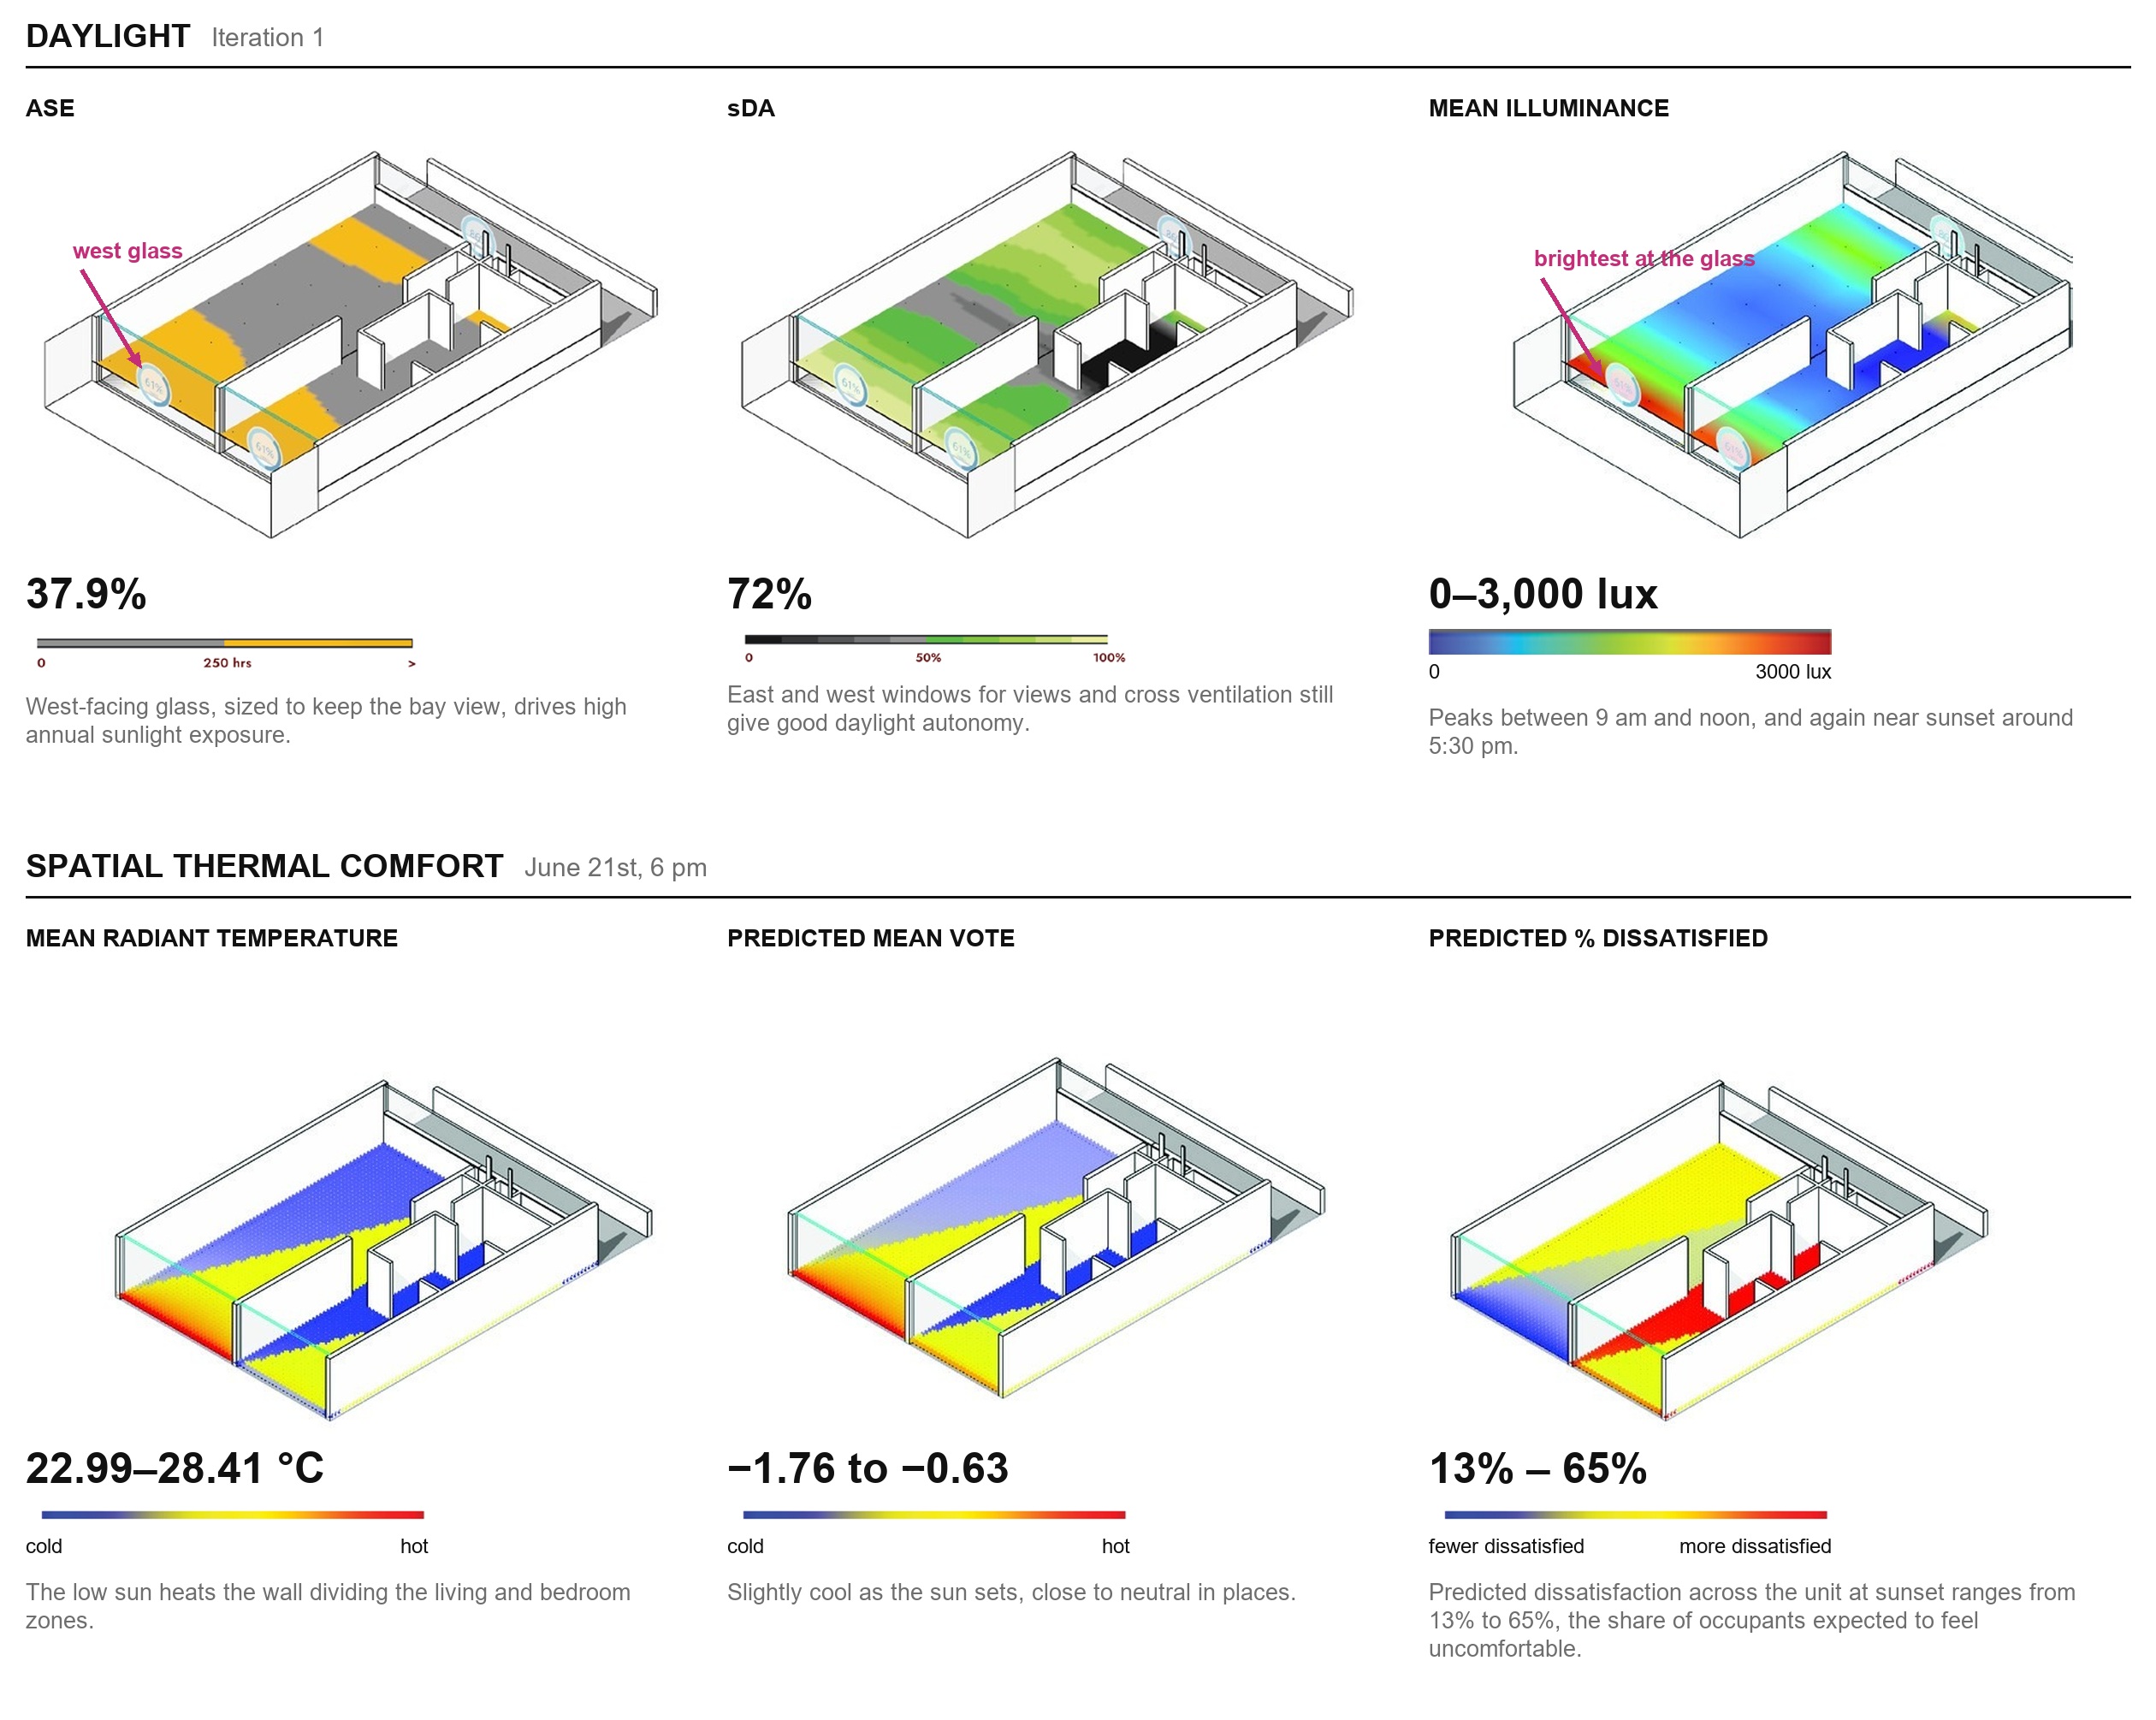
Irregular balconies act as shading devices for the floors below, with depths optimized through radiation simulation to reduce cooling demand and Energy Use Intensity. Daylight and thermal comfort studies test the result: 72% sDA, and an ASE of about 37.9% driven by the west-facing glass that frames the bay.

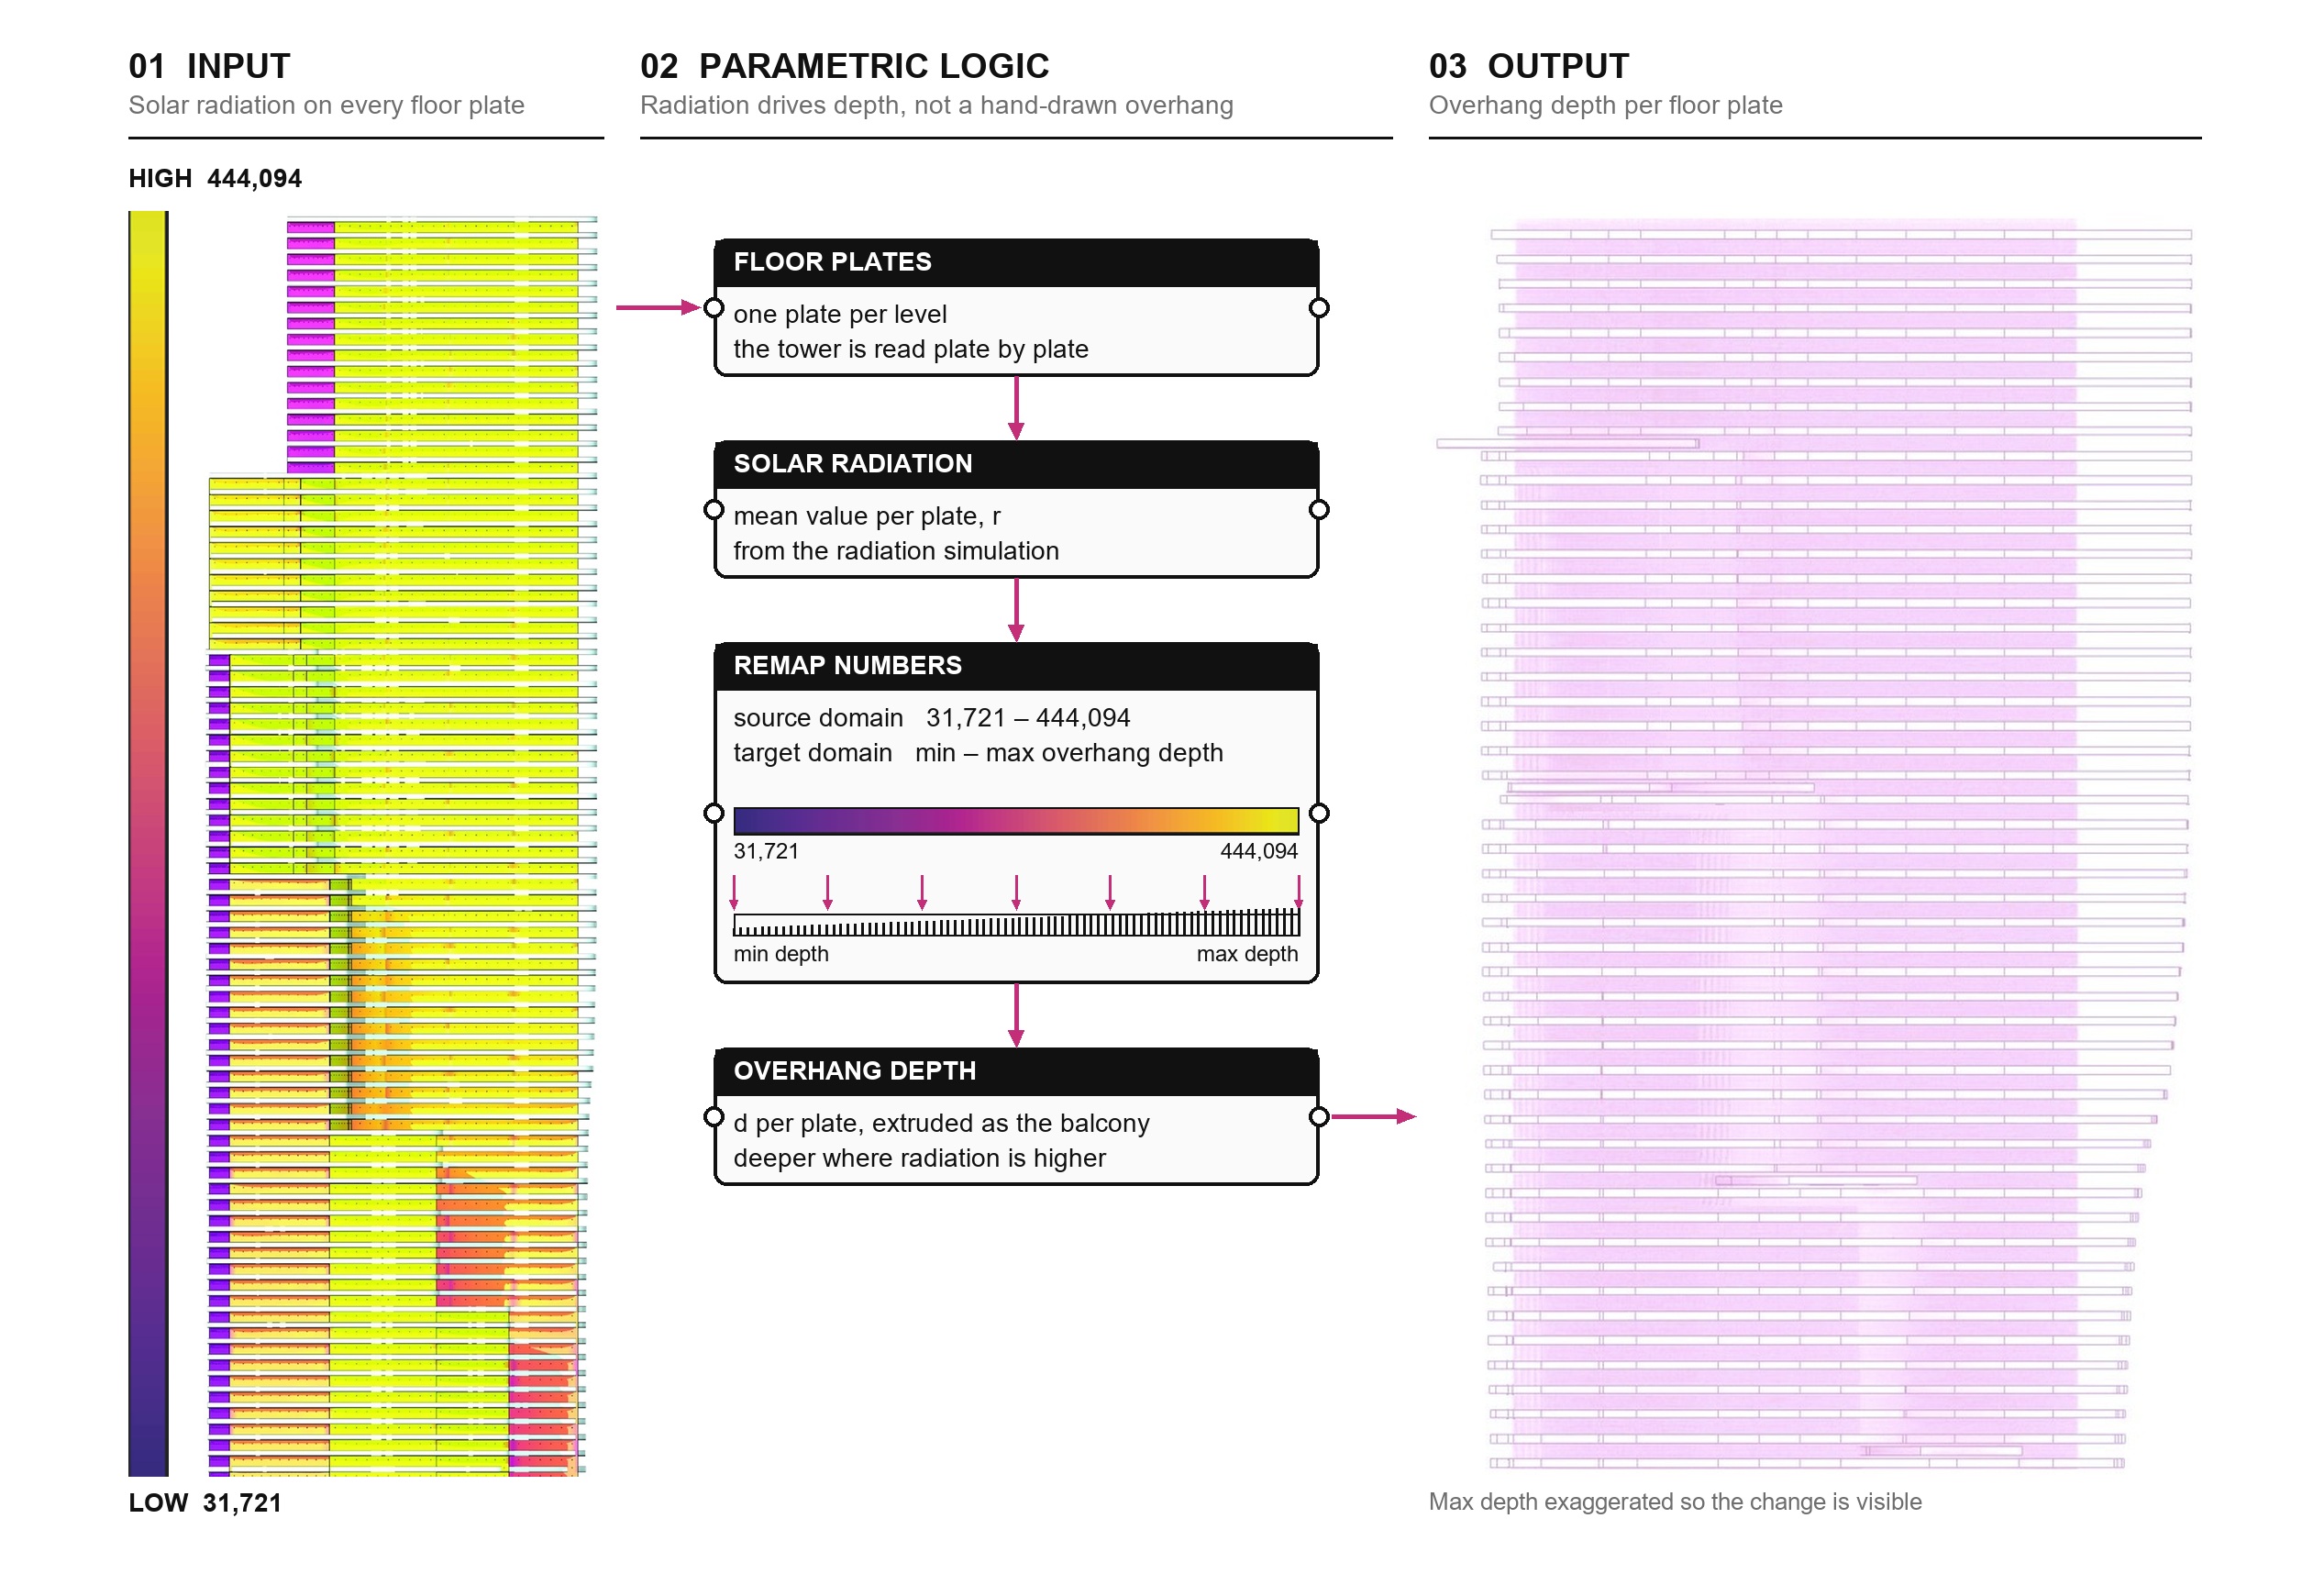
My contribution: I worked on the environmental simulations throughout the project, and I built the parametric radiation-to-form logic: each floor plate’s solar radiation is remapped to an overhang depth, so balcony depth increases where radiation is highest and updates whenever the simulation does.

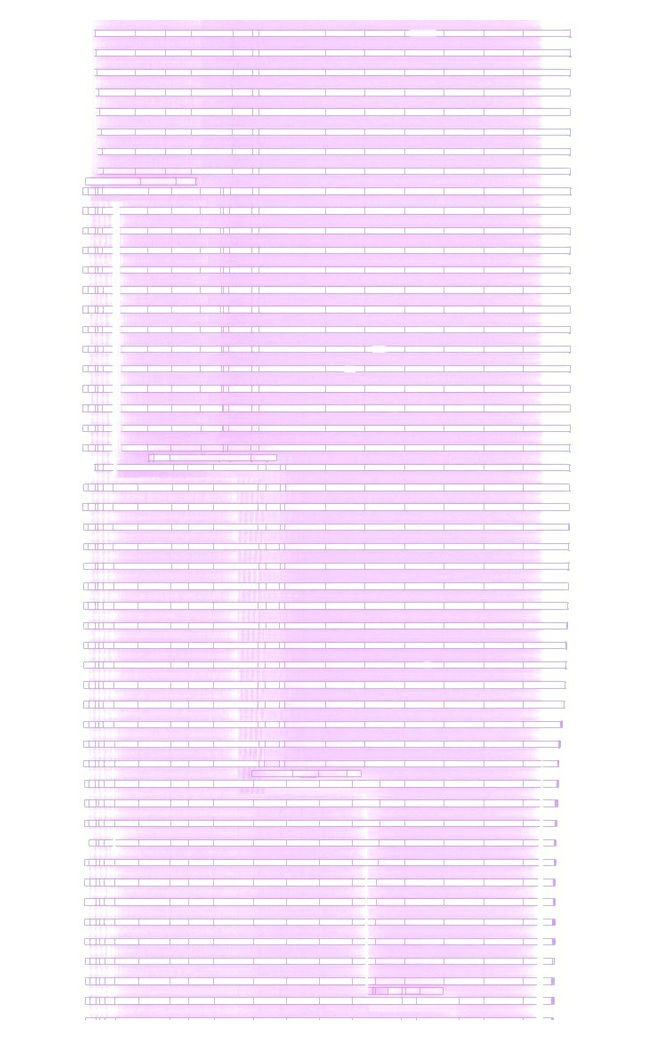
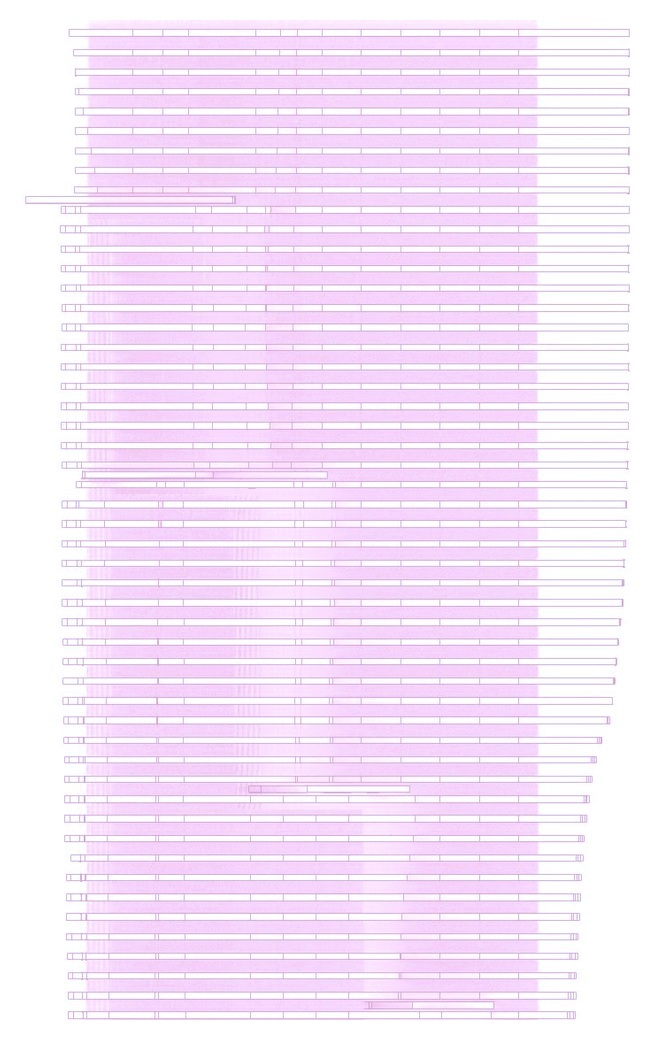
Stepped tower elevation
Site context: the bay and Balboa Park
Tower with terraces and roof gardens
Parametric logic: each floor plate's solar radiation is remapped to a balcony overhang depth, so the form responds to the simulation
Overhang depth studies: max depth exaggerated so the change is visible
Iteration 1: depth exaggerated
Iteration 2: depth exaggerated
Iteration 3: depth exaggerated
Daylight and spatial thermal comfort results for the unit
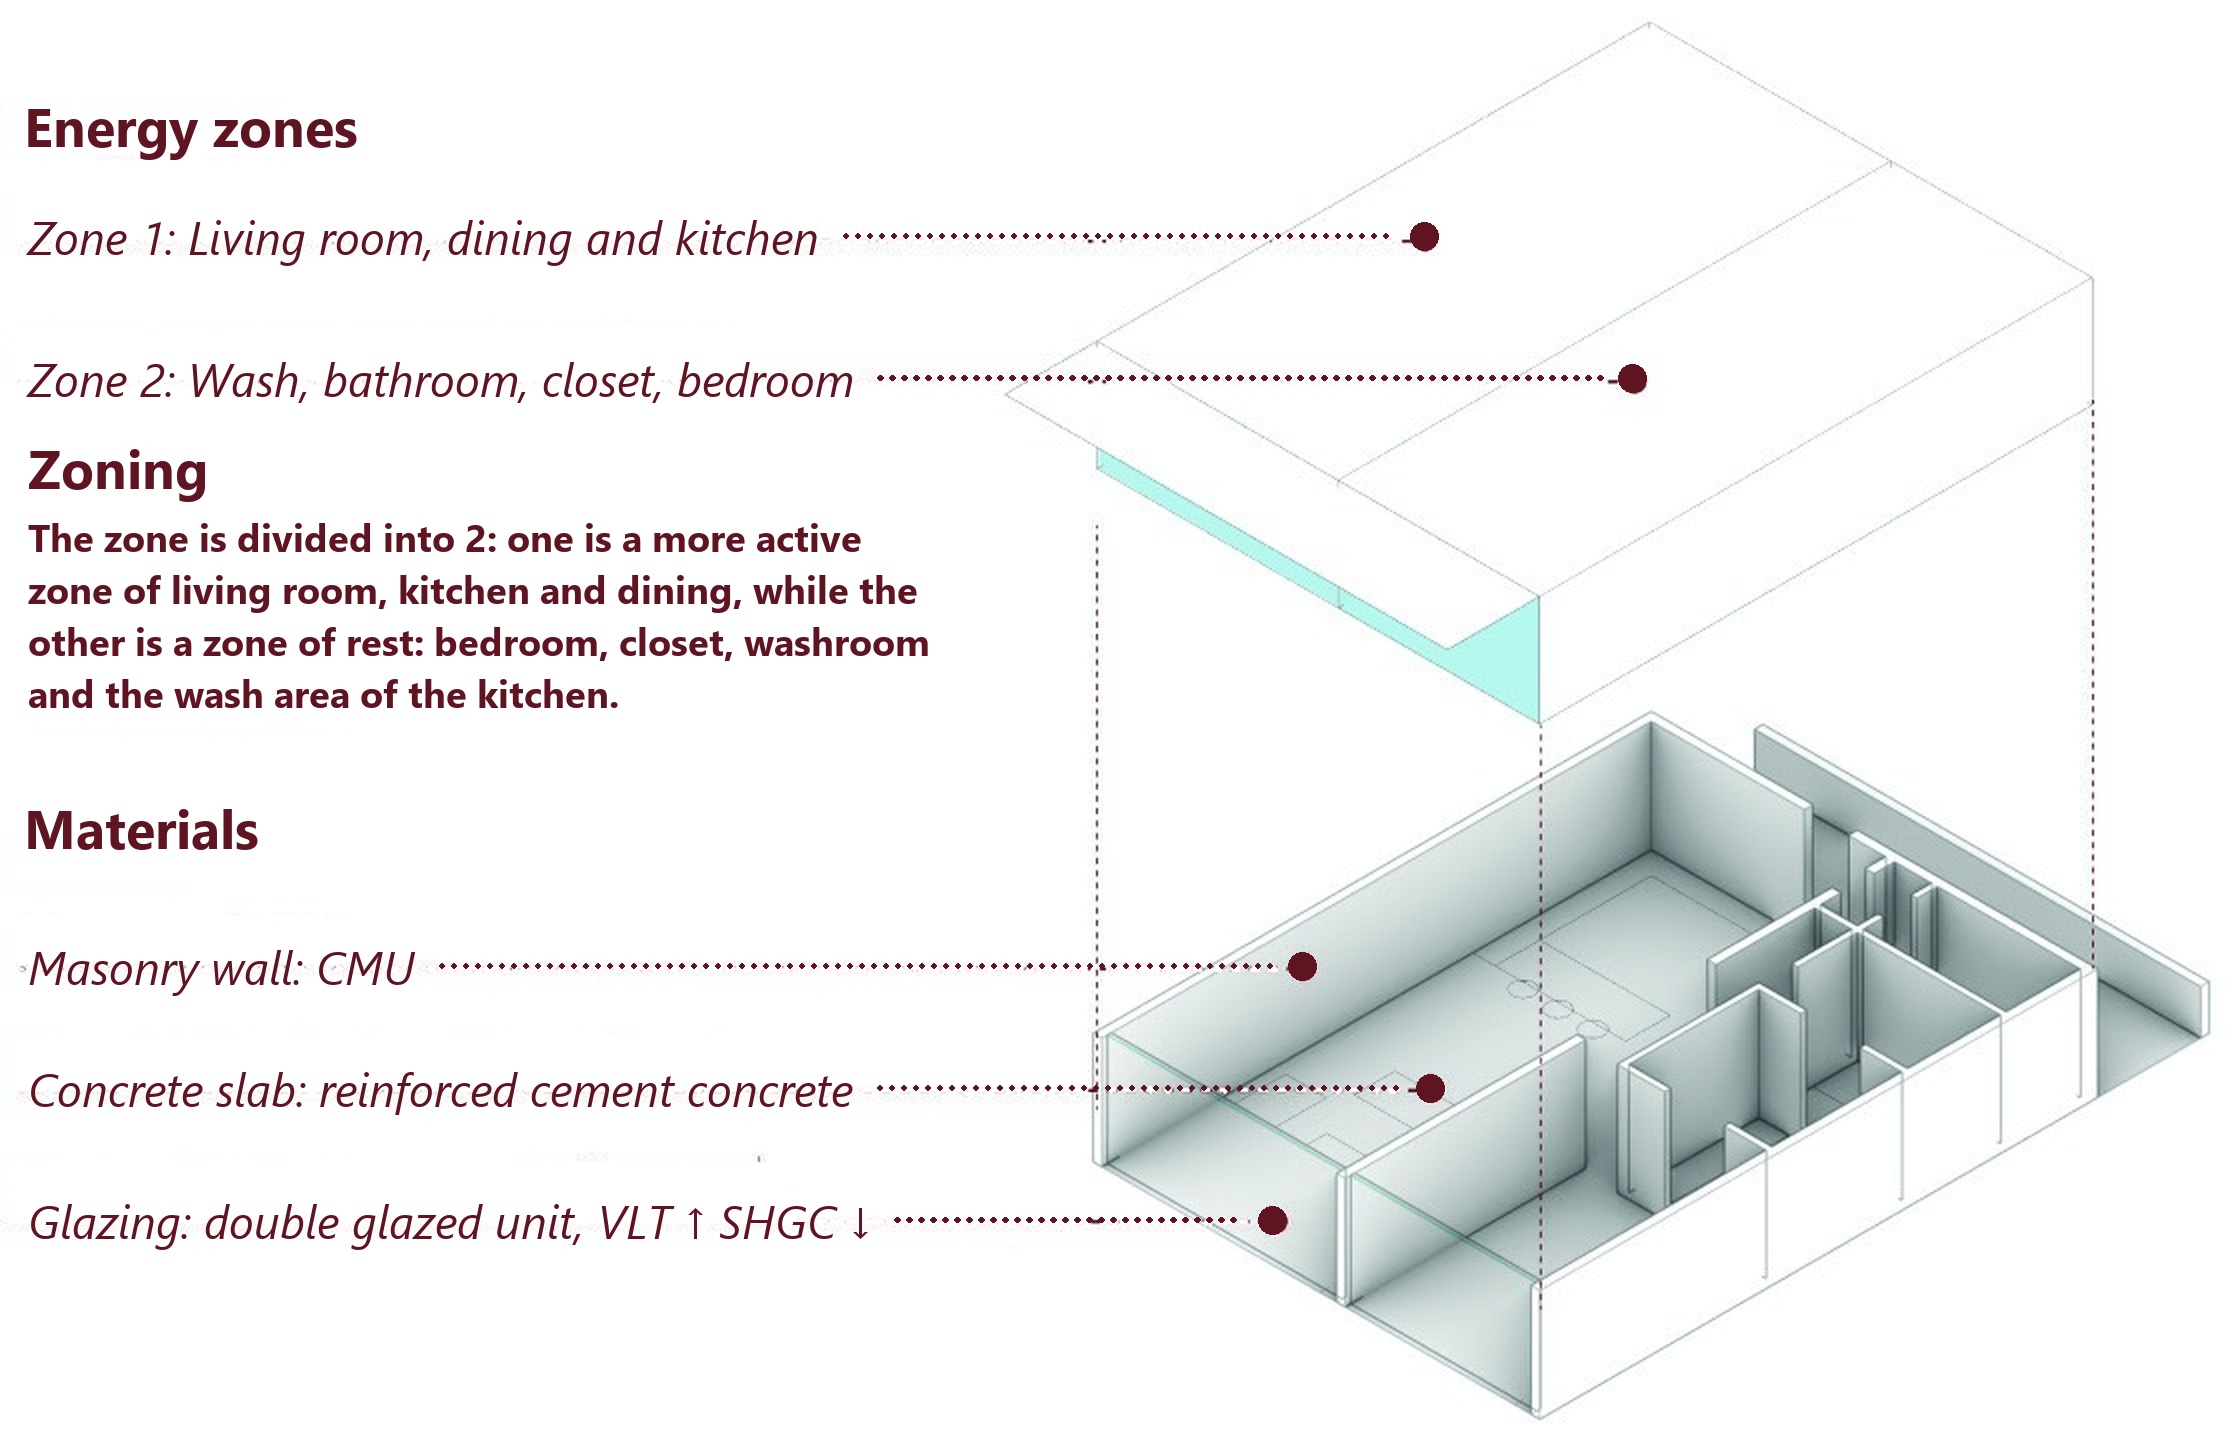
Unit energy zones and materials
Tower plan: sea view and park view

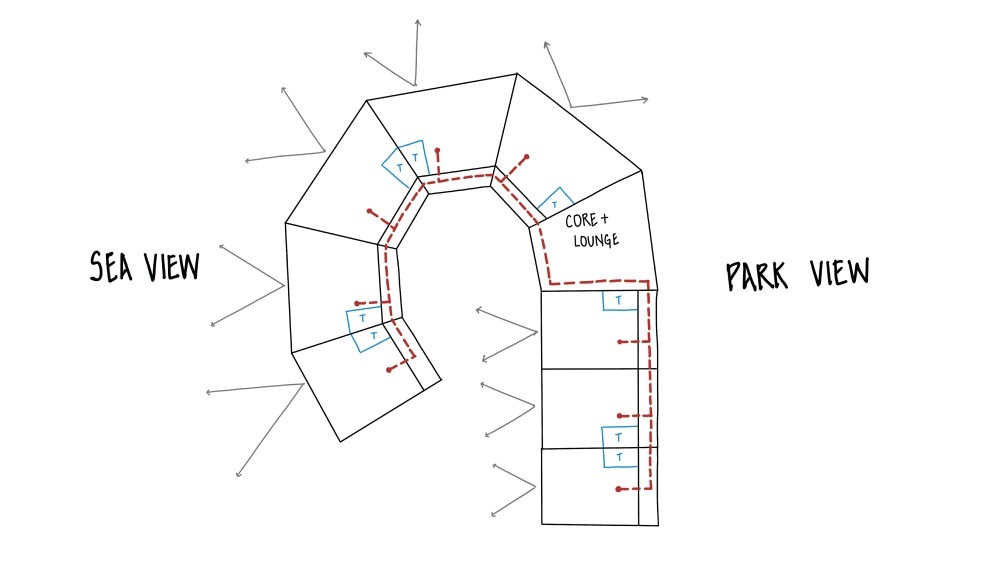
Tower plan. The floor plan bends around a central core and lounge, so the units fan out along two arms. The western arm looks toward the sea and the eastern arm toward the park, and the grey arrows show the view direction from each unit. A single circulation line (red, dashed) runs along the core and branches into every unit, so each one is reached from the same spine while keeping its own view and cross ventilation.

04

Residential Retrofit and Redesign

Year
Fall 2025
Type
Energy assessment, retrofit
Location
Gloucester, MA
Focus
Passive solar heating

Two paths to efficiency for a duplex in a cold coastal climate: one ideal, one buildable.

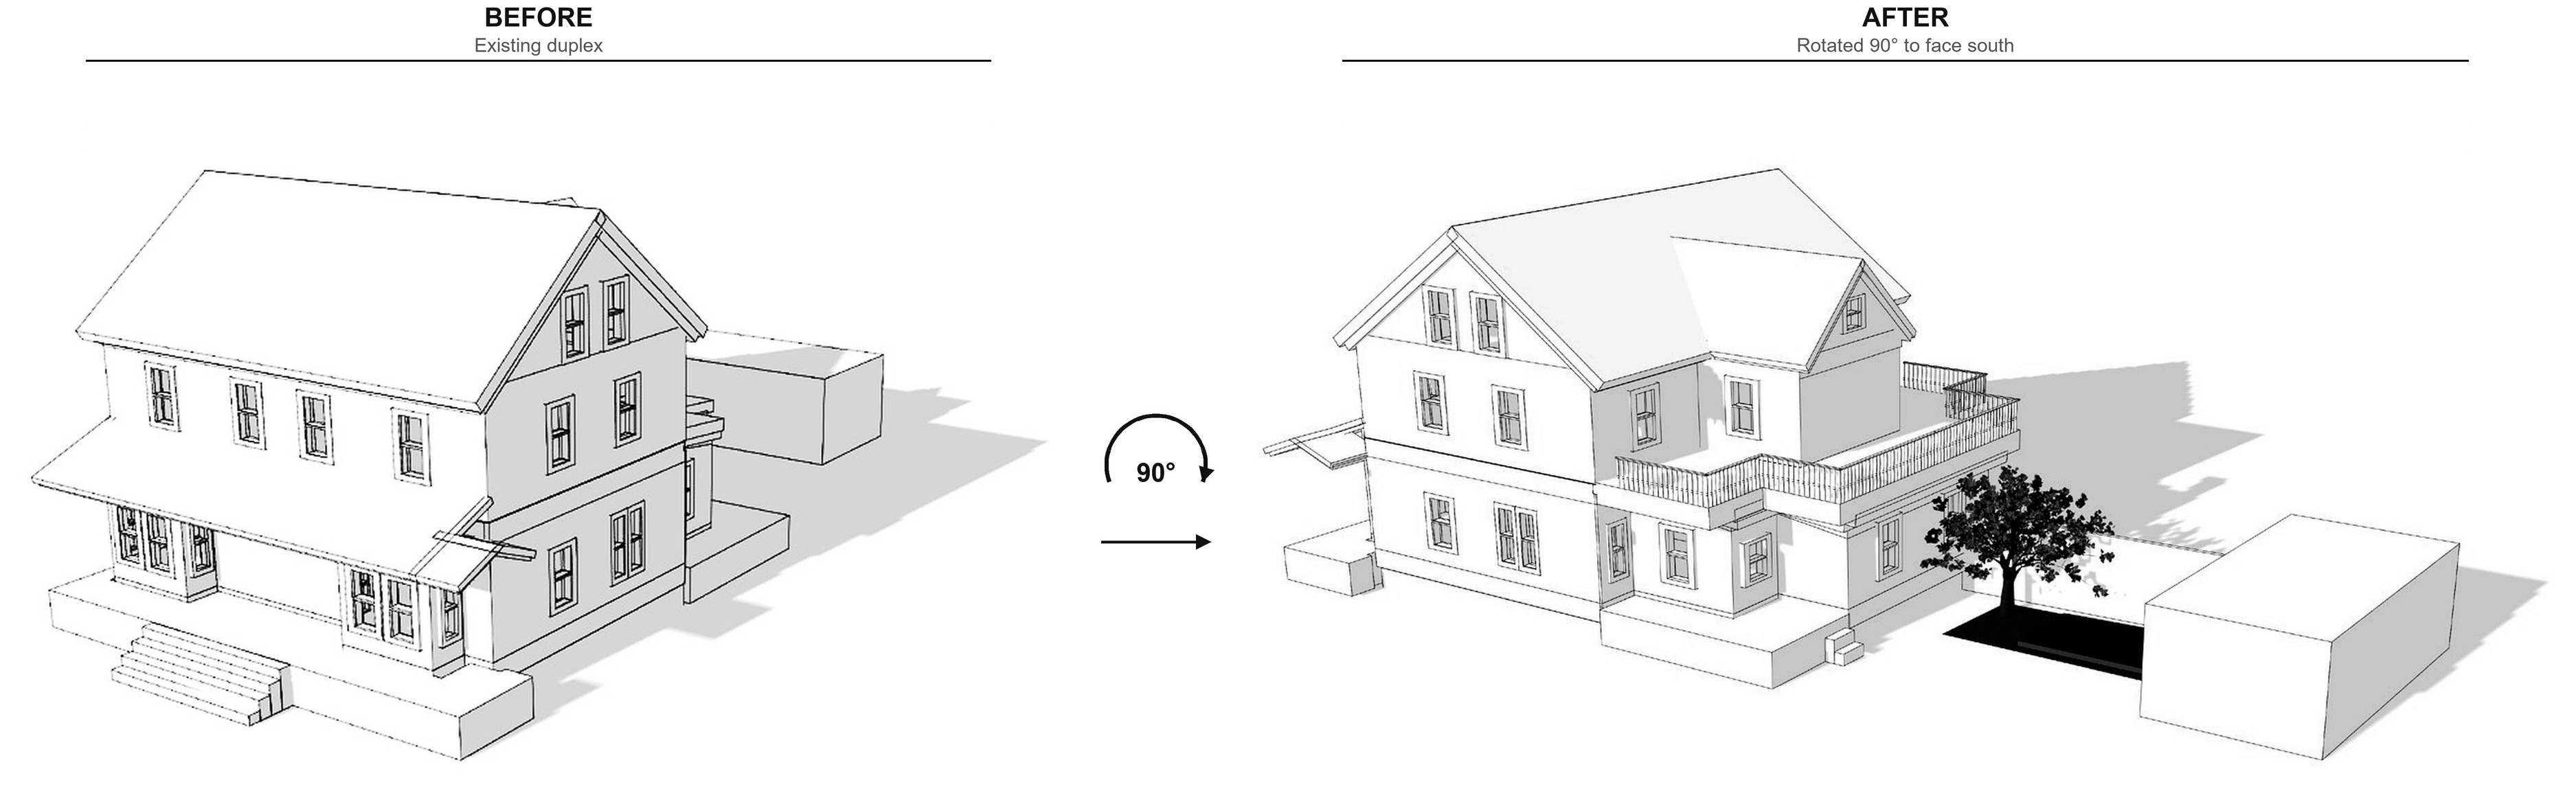
Unit 39 gets some morning sun but limited afternoon solar gain because of the wall it shares with its neighbor. The theoretical redesign rotates the building 90 degrees to face south and maximize winter gain. It is the ideal configuration, and not feasible for the existing structure.

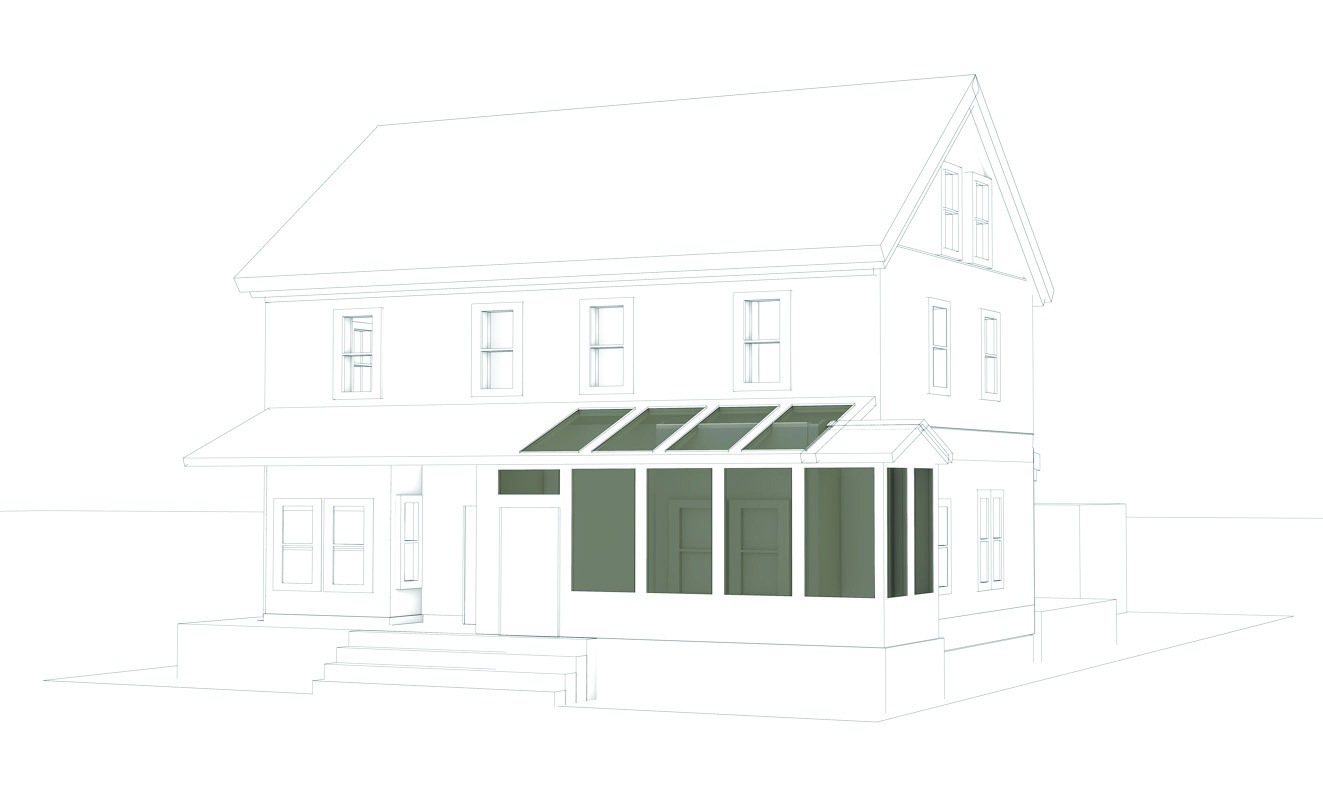
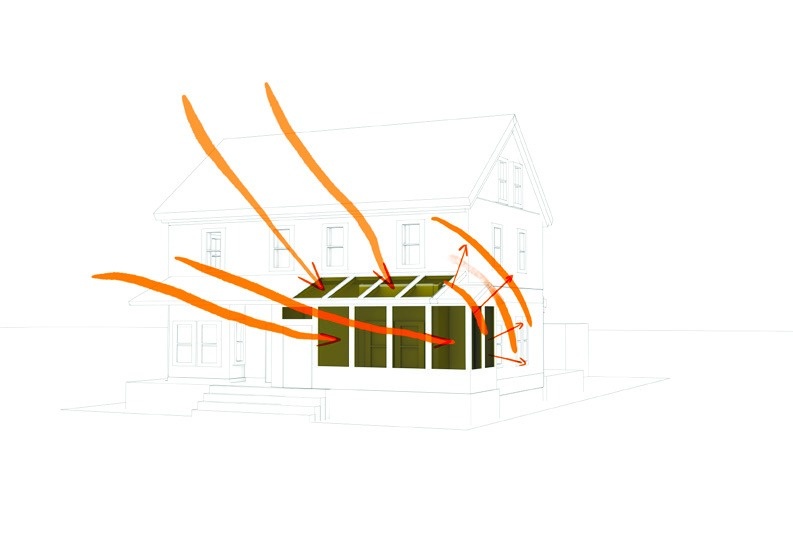
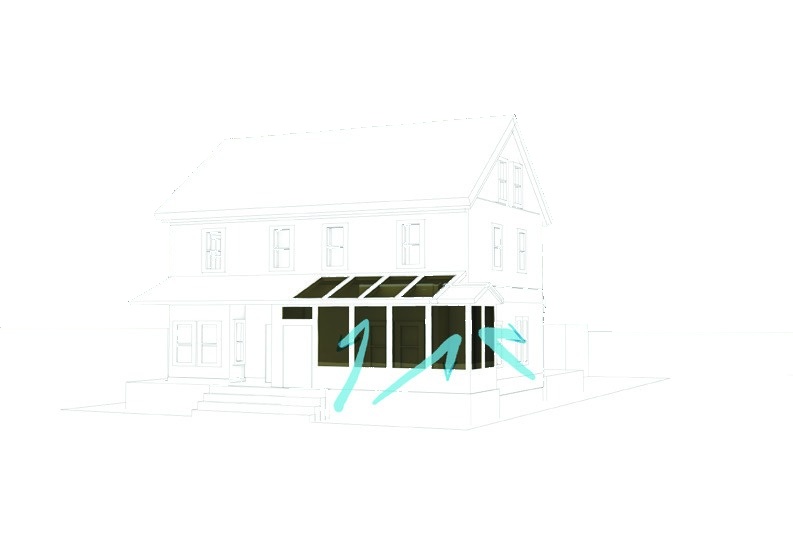
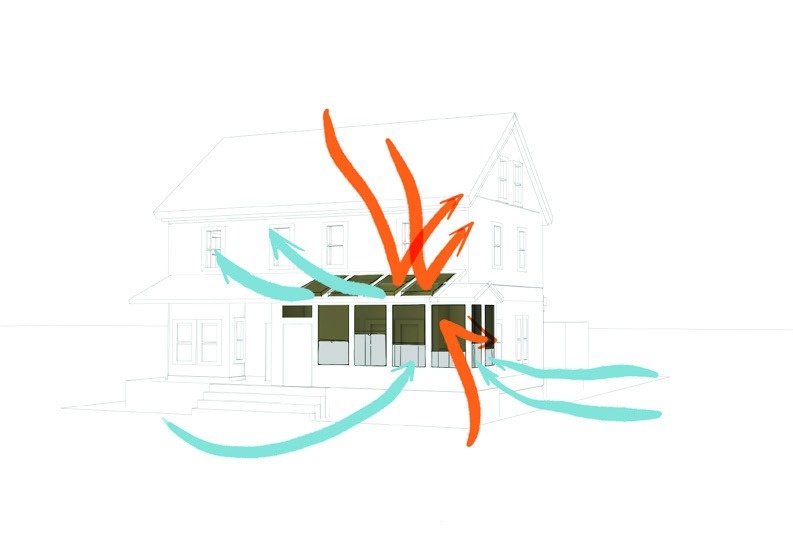
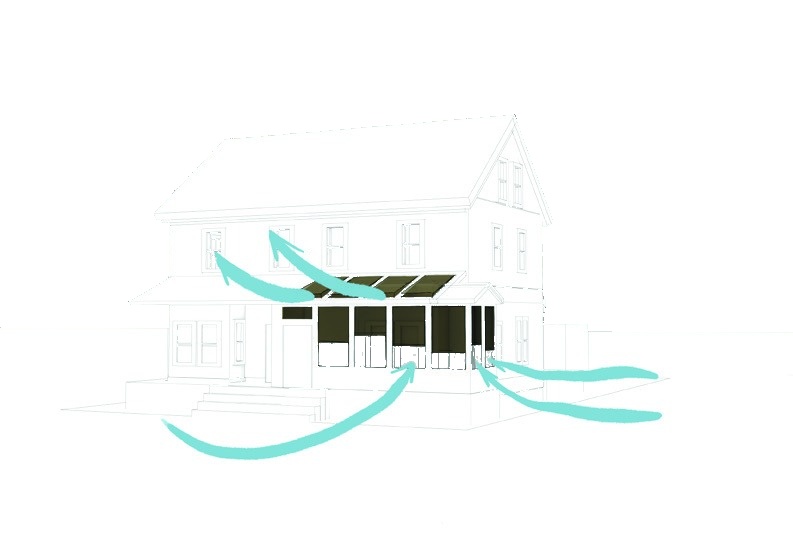
The recommended retrofit is a sunspace built on the existing south porch: a glass enclosure with operable windows and skylights that reopens as a porch in summer. It warms interior surfaces and air passively, reducing space heating, the home’s main energy load, with night insulation shades and the common wall helping distribute heat.

Before and after: the existing duplex (left) and the theoretical redesign, rotated 90° to face south (right)
Recommended sunspace
Winter day: low sun enters the glazing and warms the house
Winter night: shades closed, cold bounces off the glazing
Summer day: hot air exits high while cool air is drawn in low
Summer night: cool air flushes the sunspace and rises out through the upper windows
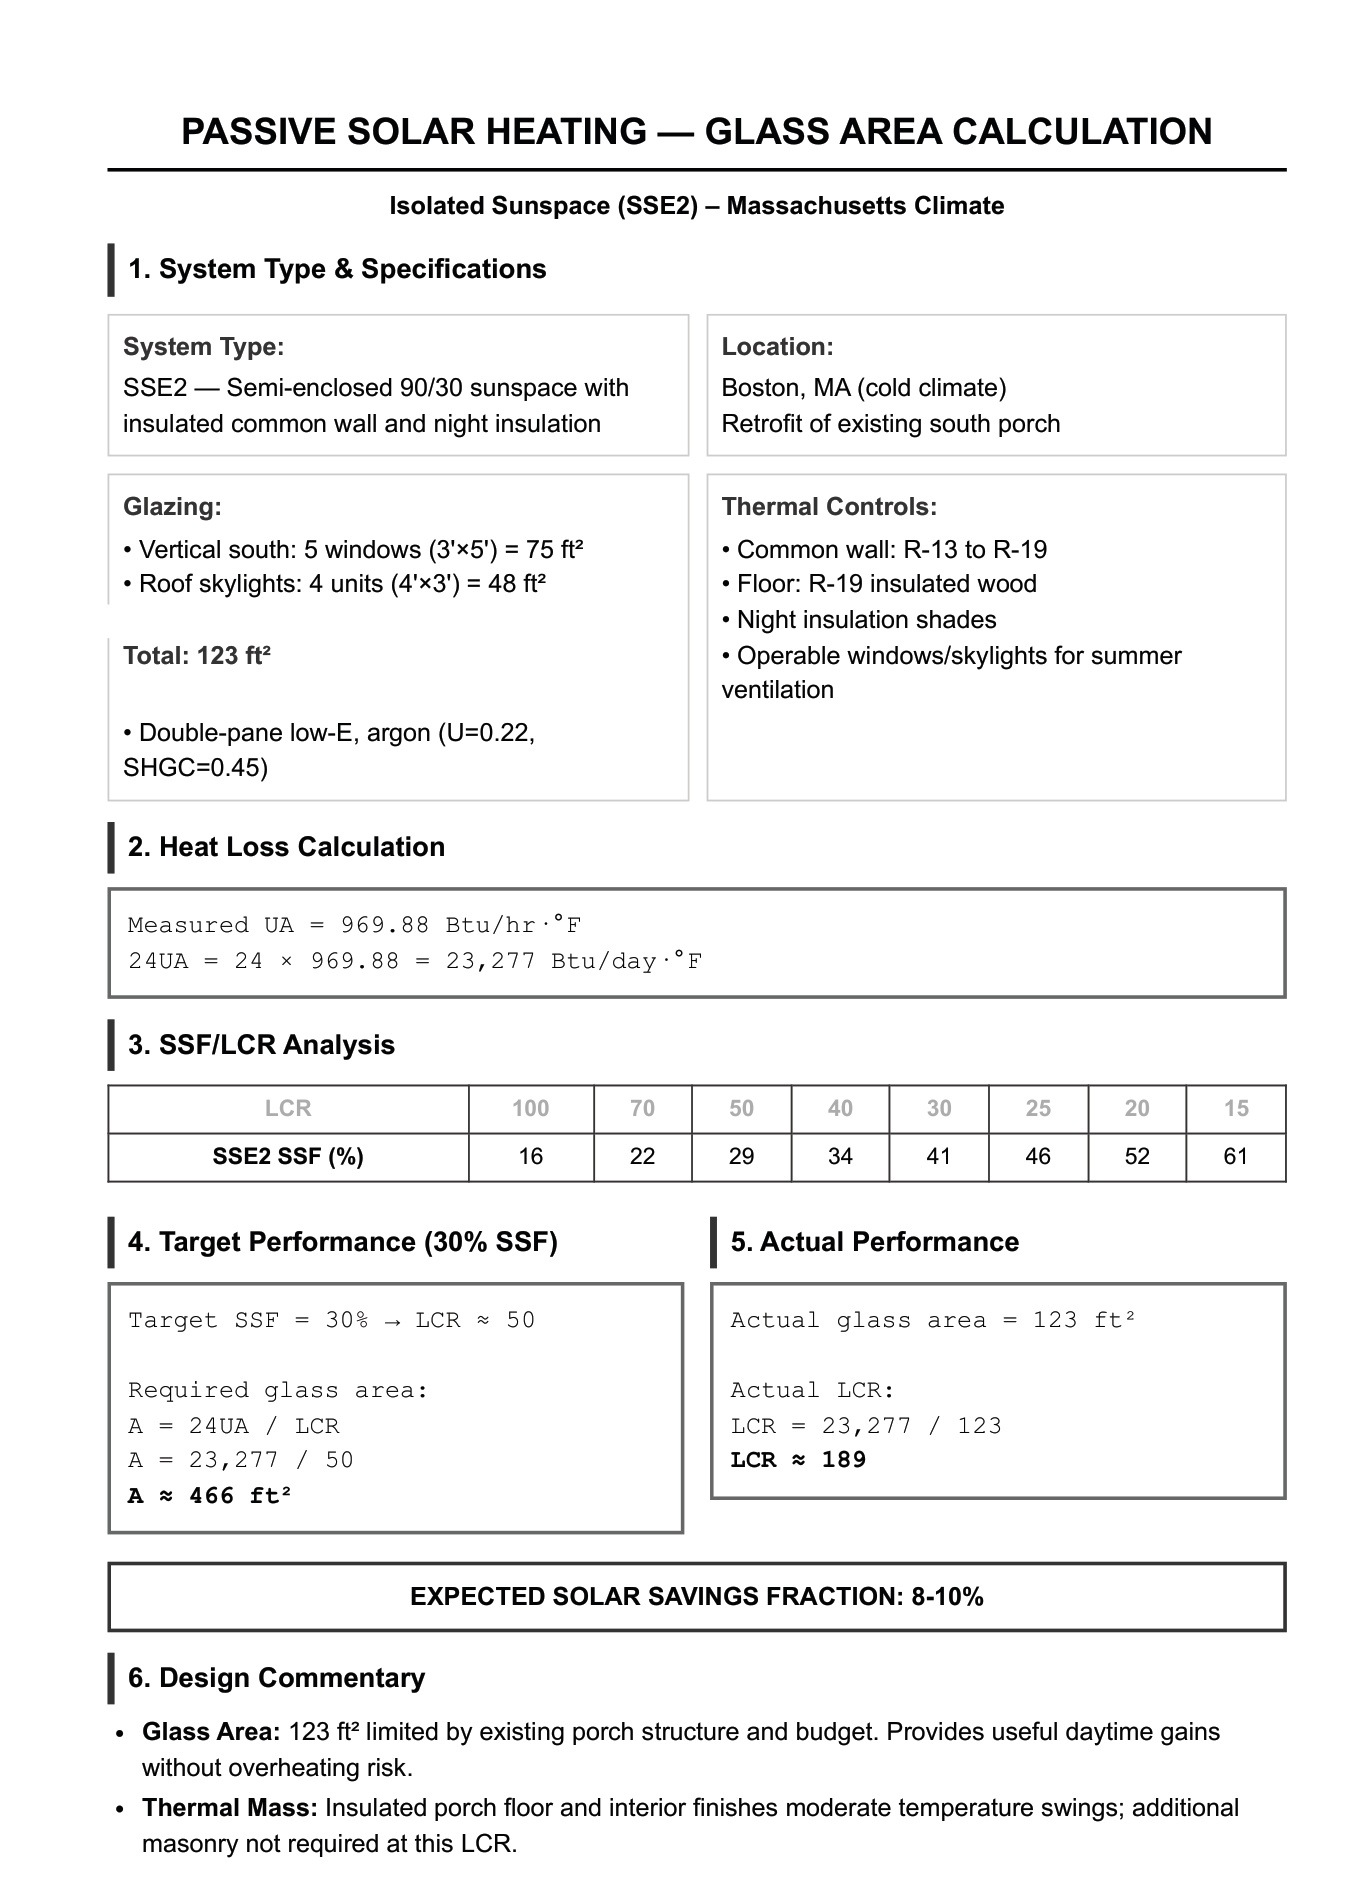
Passive solar heating: glass area calculation
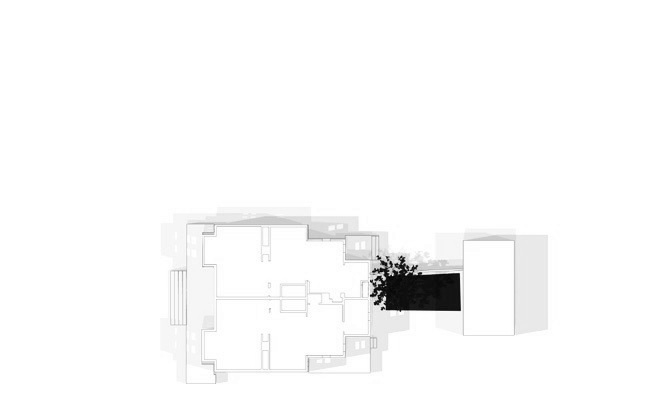
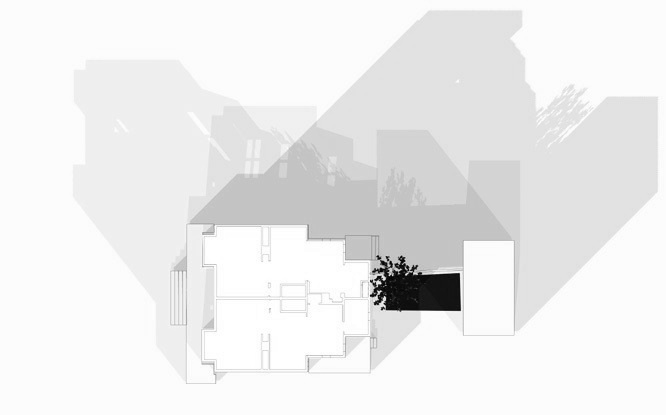
Plan, summer shadows
Plan, winter shadows
05

Heliotrope

Year
Fall 2026
Type
Parametric shading canopy
Course
48-724 Scripting and Parametric Design, Fall 2026
Precedent
Federation Square facade, reconstructed parametrically
Tools
Rhino, Grasshopper, Python

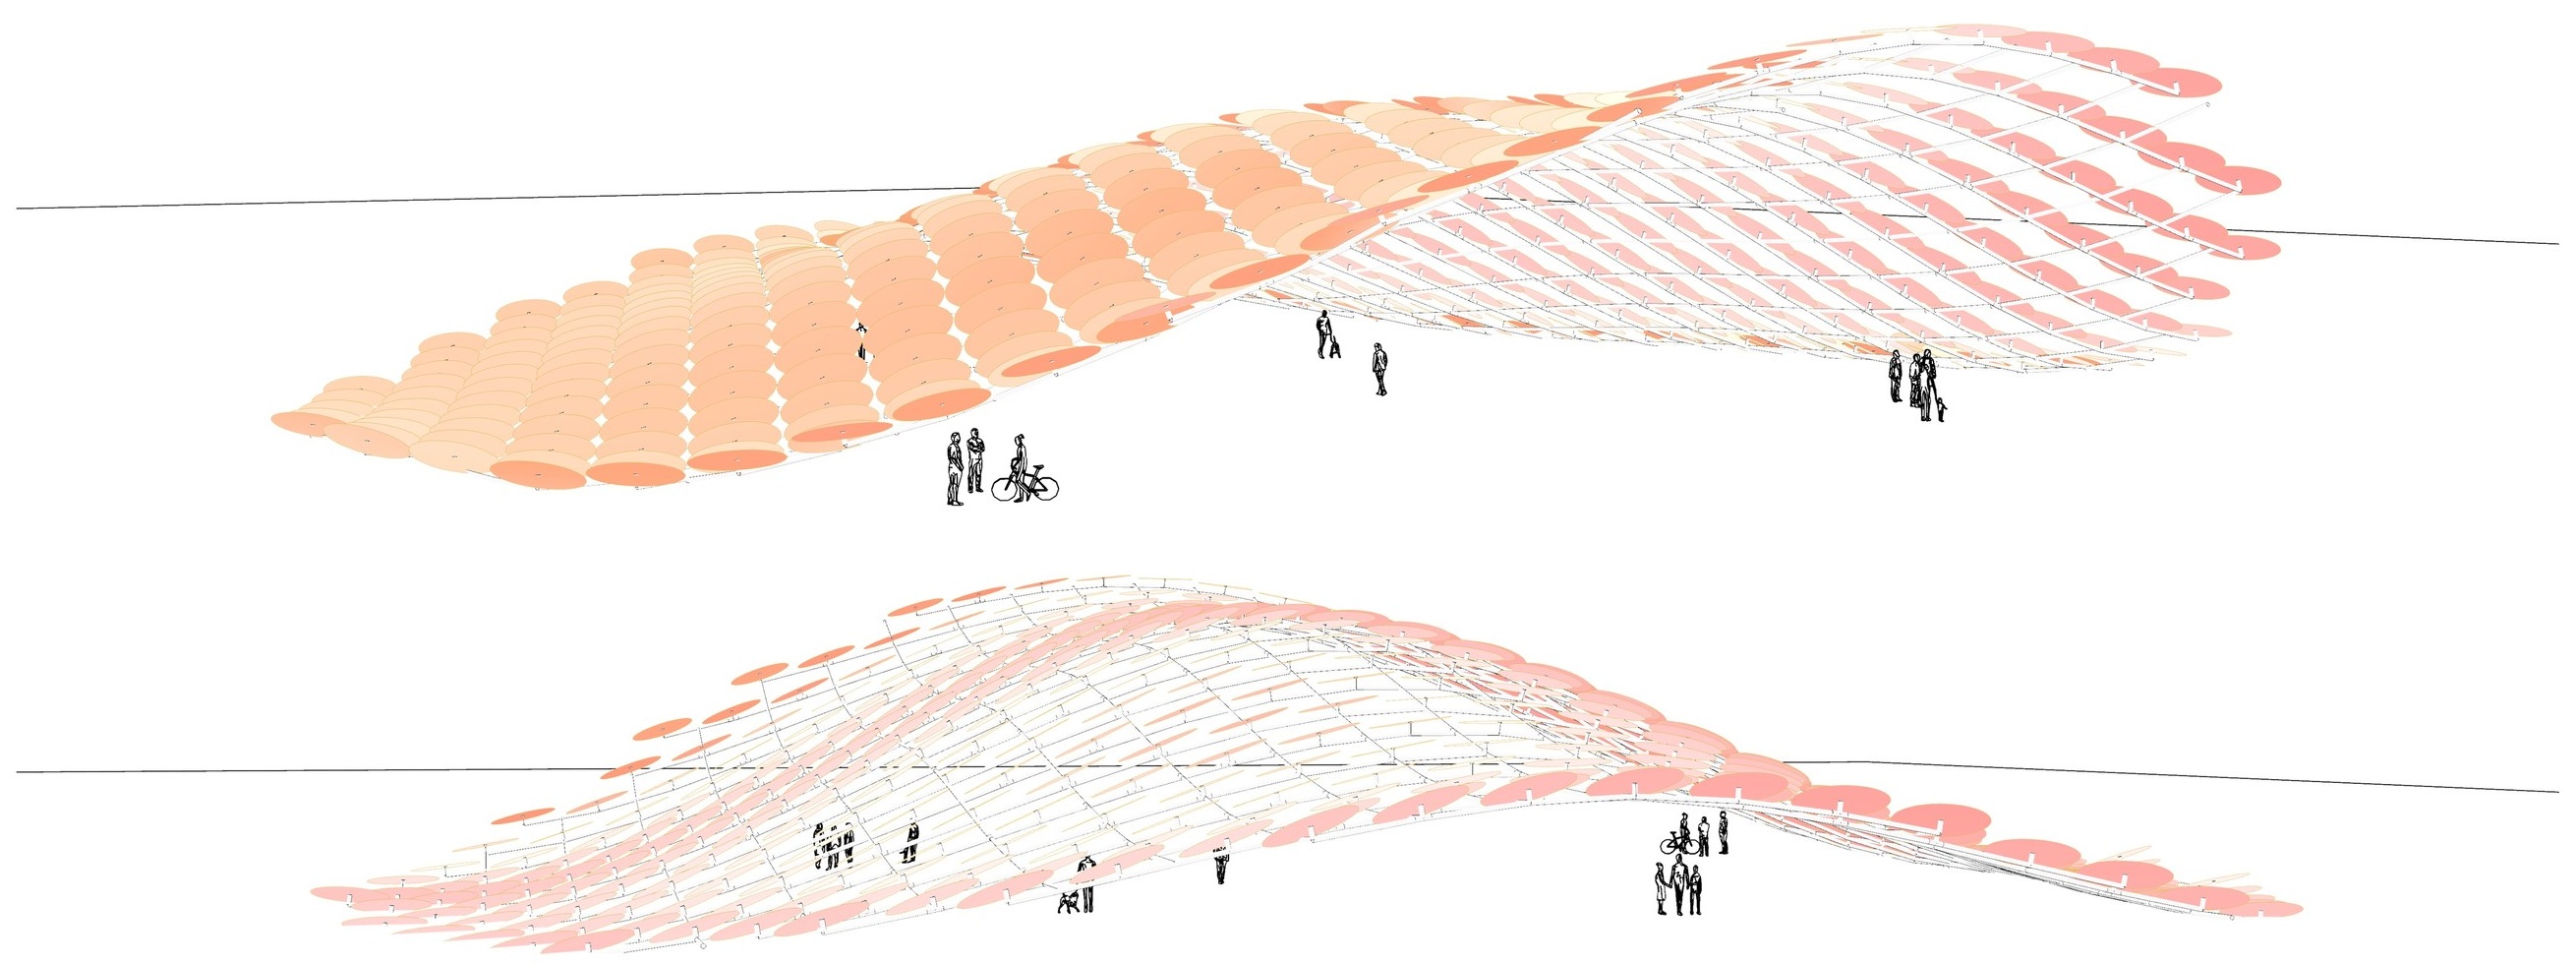
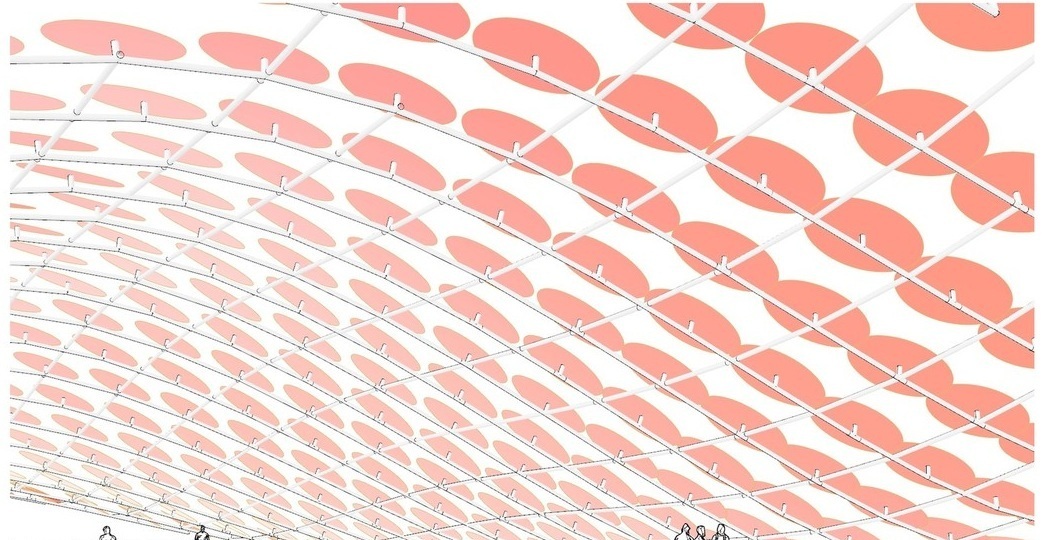
A canopy that turns its face to the sun, disc by disc, derived from the Federation Square facade.

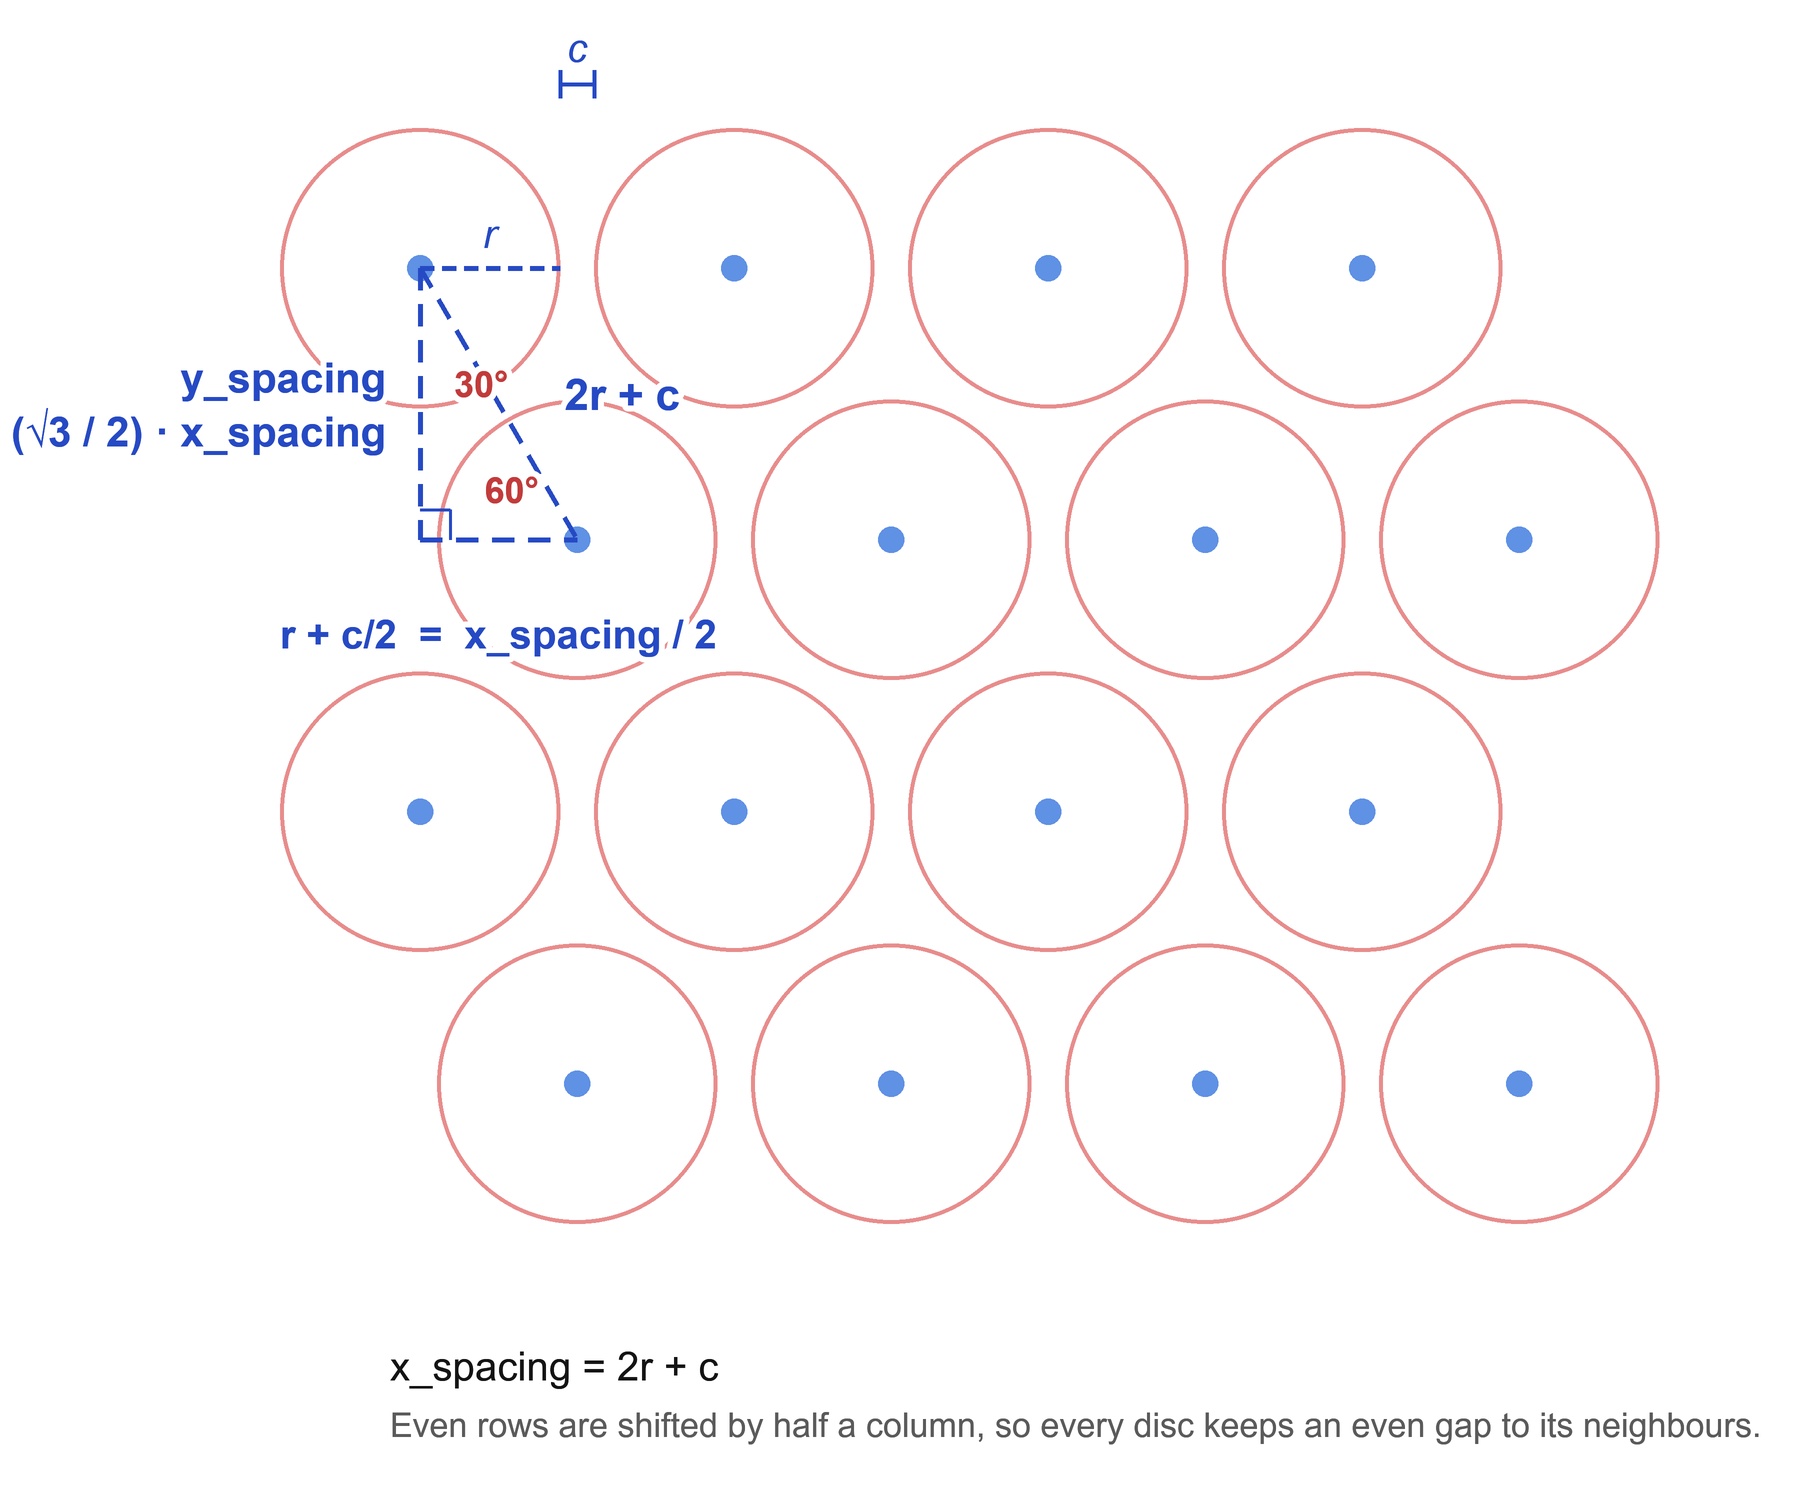
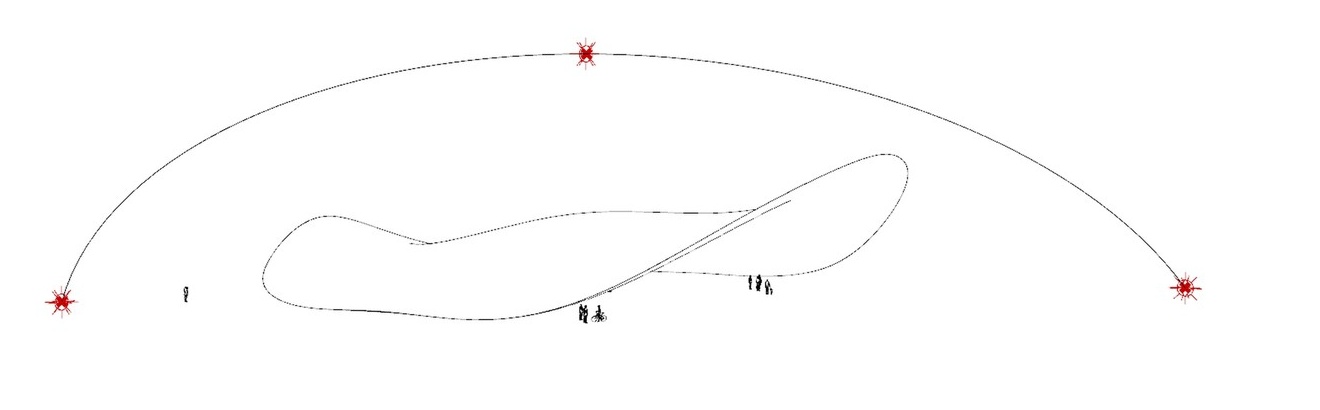
Heliotrope is a generative shading canopy built in Rhino Python and Grasshopper. Circular discs are packed on a hexagonal grid: row spacing is derived from column spacing with a 30-60-90 triangle, so every disc keeps an even gap to its neighbors in all directions.

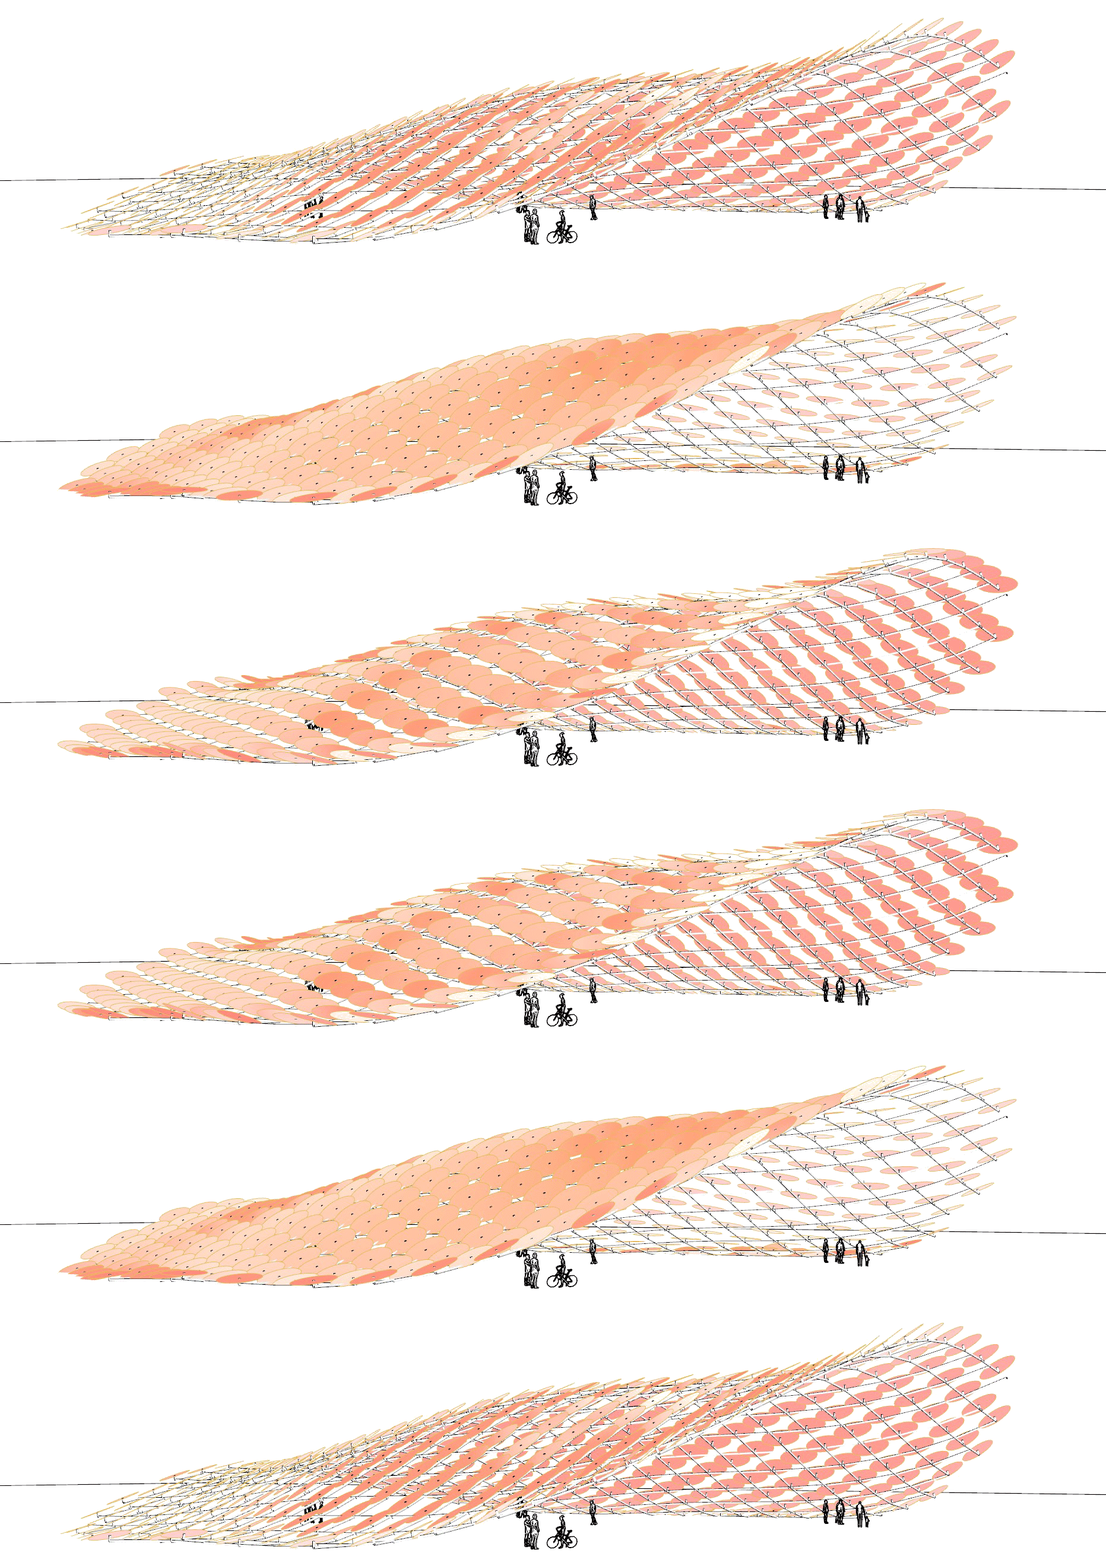
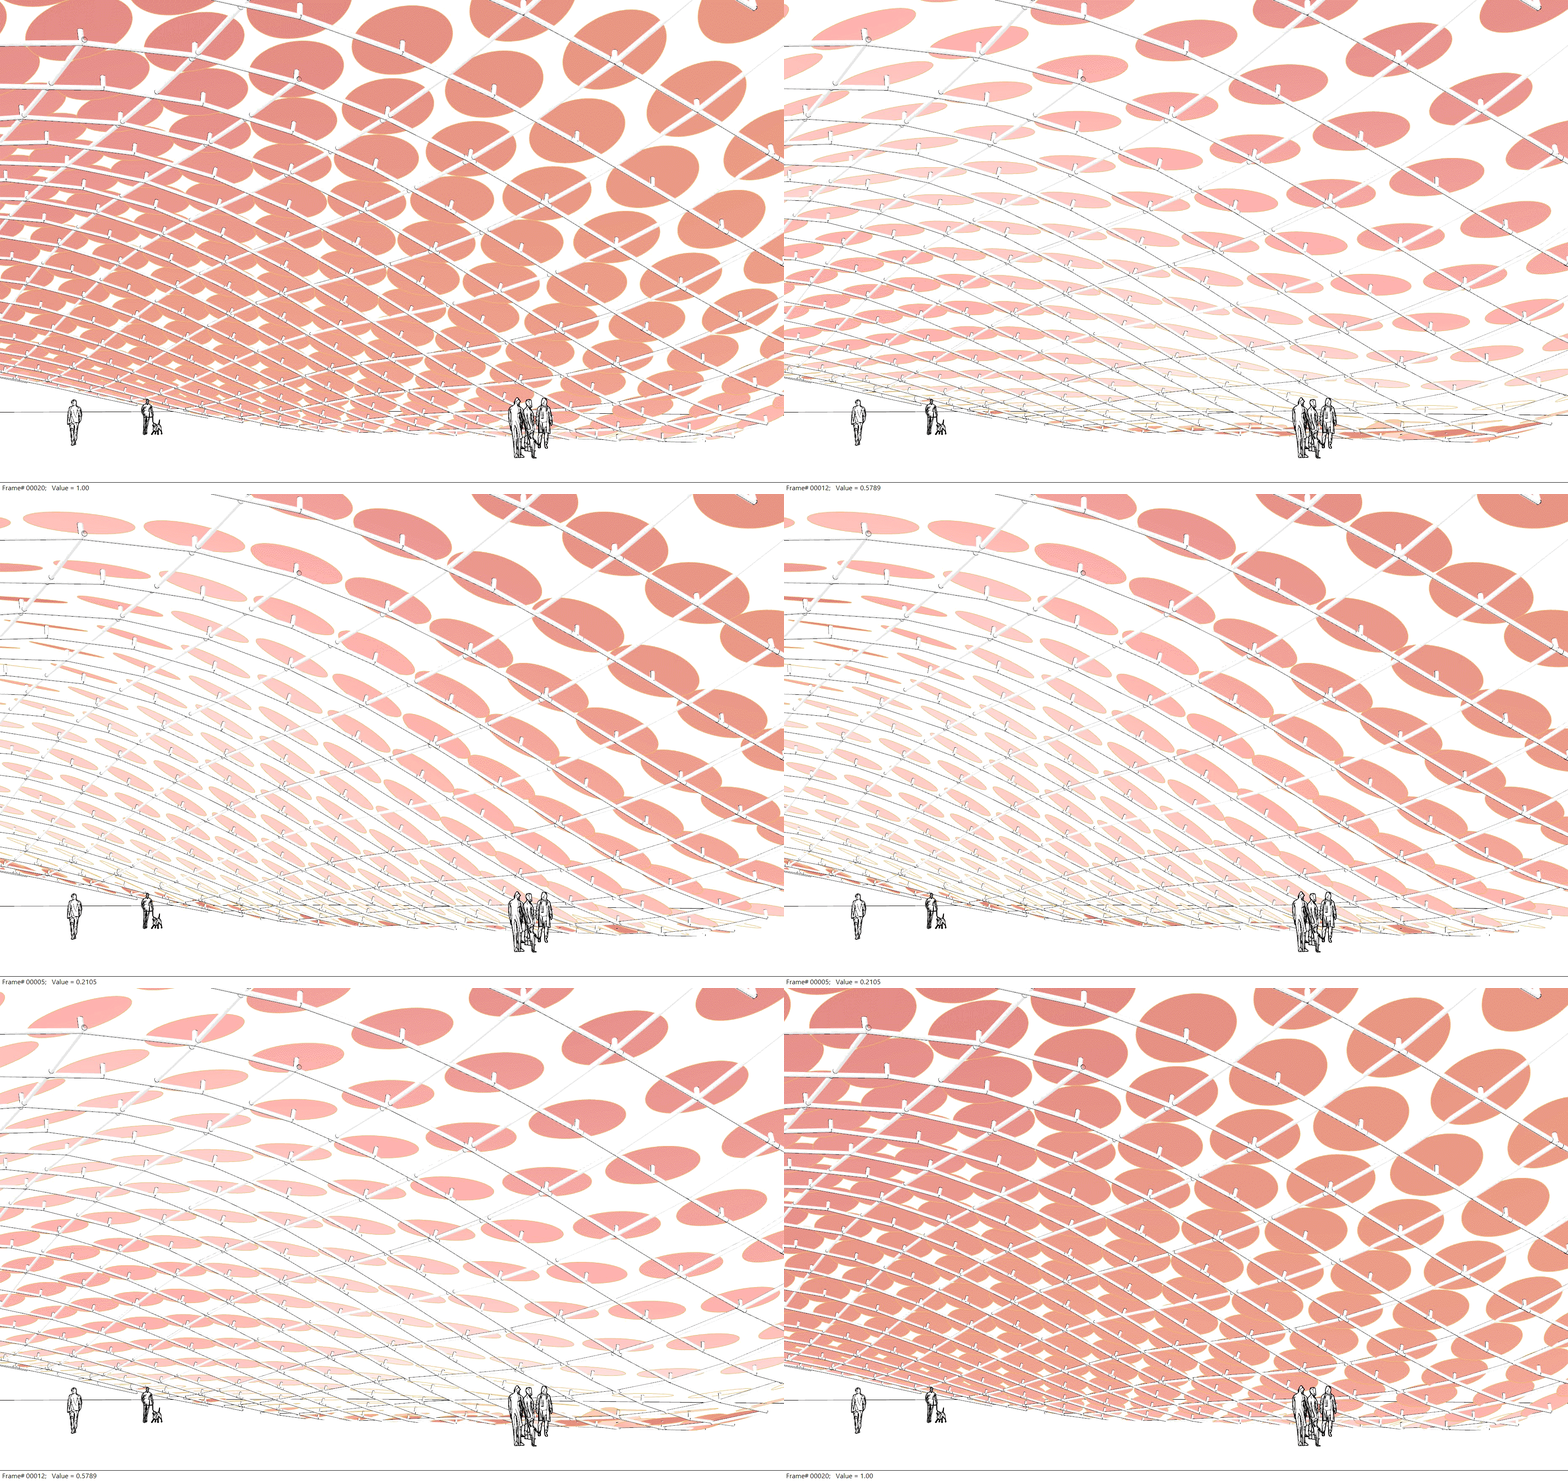
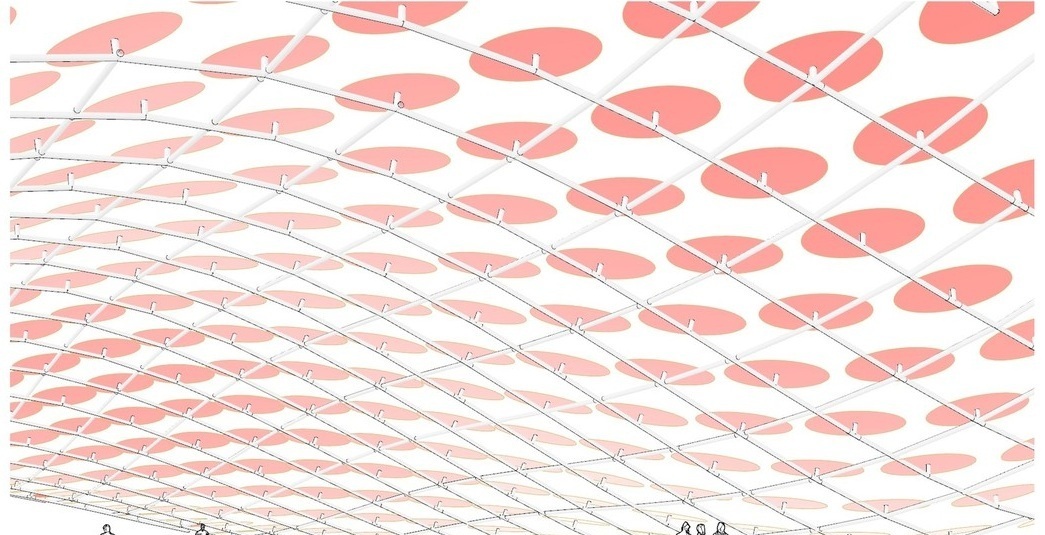
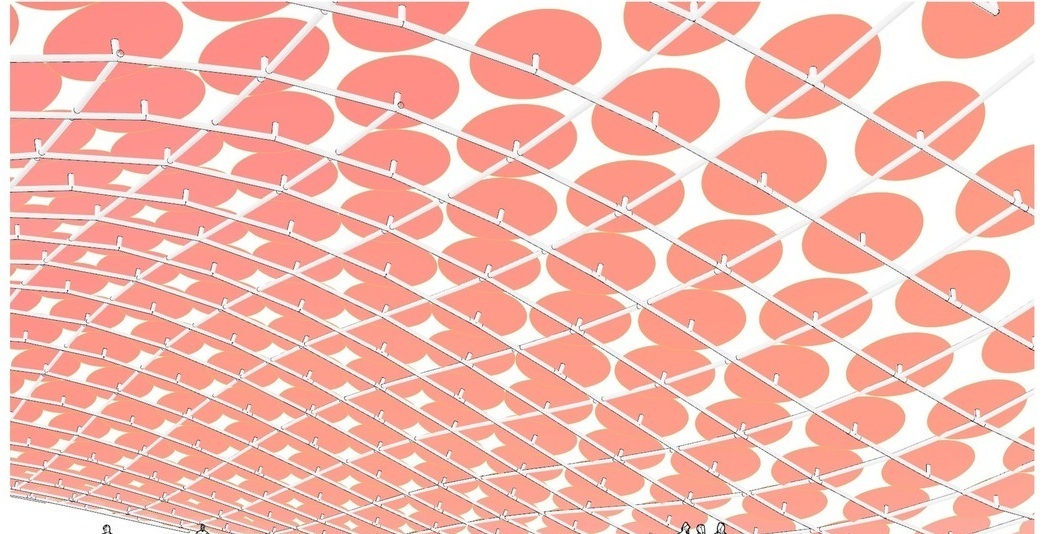
A sun-path arc acts as the attractor. As the sun moves from morning to evening it drives the tilt of each disc, and the views across the day show the field opening and closing.

Animated Heliotrope canopy
Disc tilt following the sun path through the day (animation)
Animated close view of Heliotrope discs
Close view from below: discs open and close through the day (animation)
Generative logic: hexagonal disc packing and the 30-60-90 triangle that sets row spacing
Sun path (attractor arc) driving disc tilt through the day

Precedent: the disc field is derived from an analysis of the Federation Square facade.

Row spacing is derived from column spacing using a 30-60-90 triangle. Since the hypotenuse (2r + c) is twice the adjacent side (r + c/2), rows must be spaced √3/2 times the column spacing, so every disc keeps an even gap to its neighbors in every direction.

Key views: the canopy from two angles
Morning
Morning
Midday
Midday
Evening
Evening
06

Multi-Density Myco-Blocks

Year
Spring 2026
Type
Multi-density mycelium wall system
Method
CNC molds, vacuum forming, hydraulic compression, 3D-printed jigs
Material
Mycelium, carnauba and beeswax finish

Mycelium as both material and form generator, now built up into multi-density blocks.

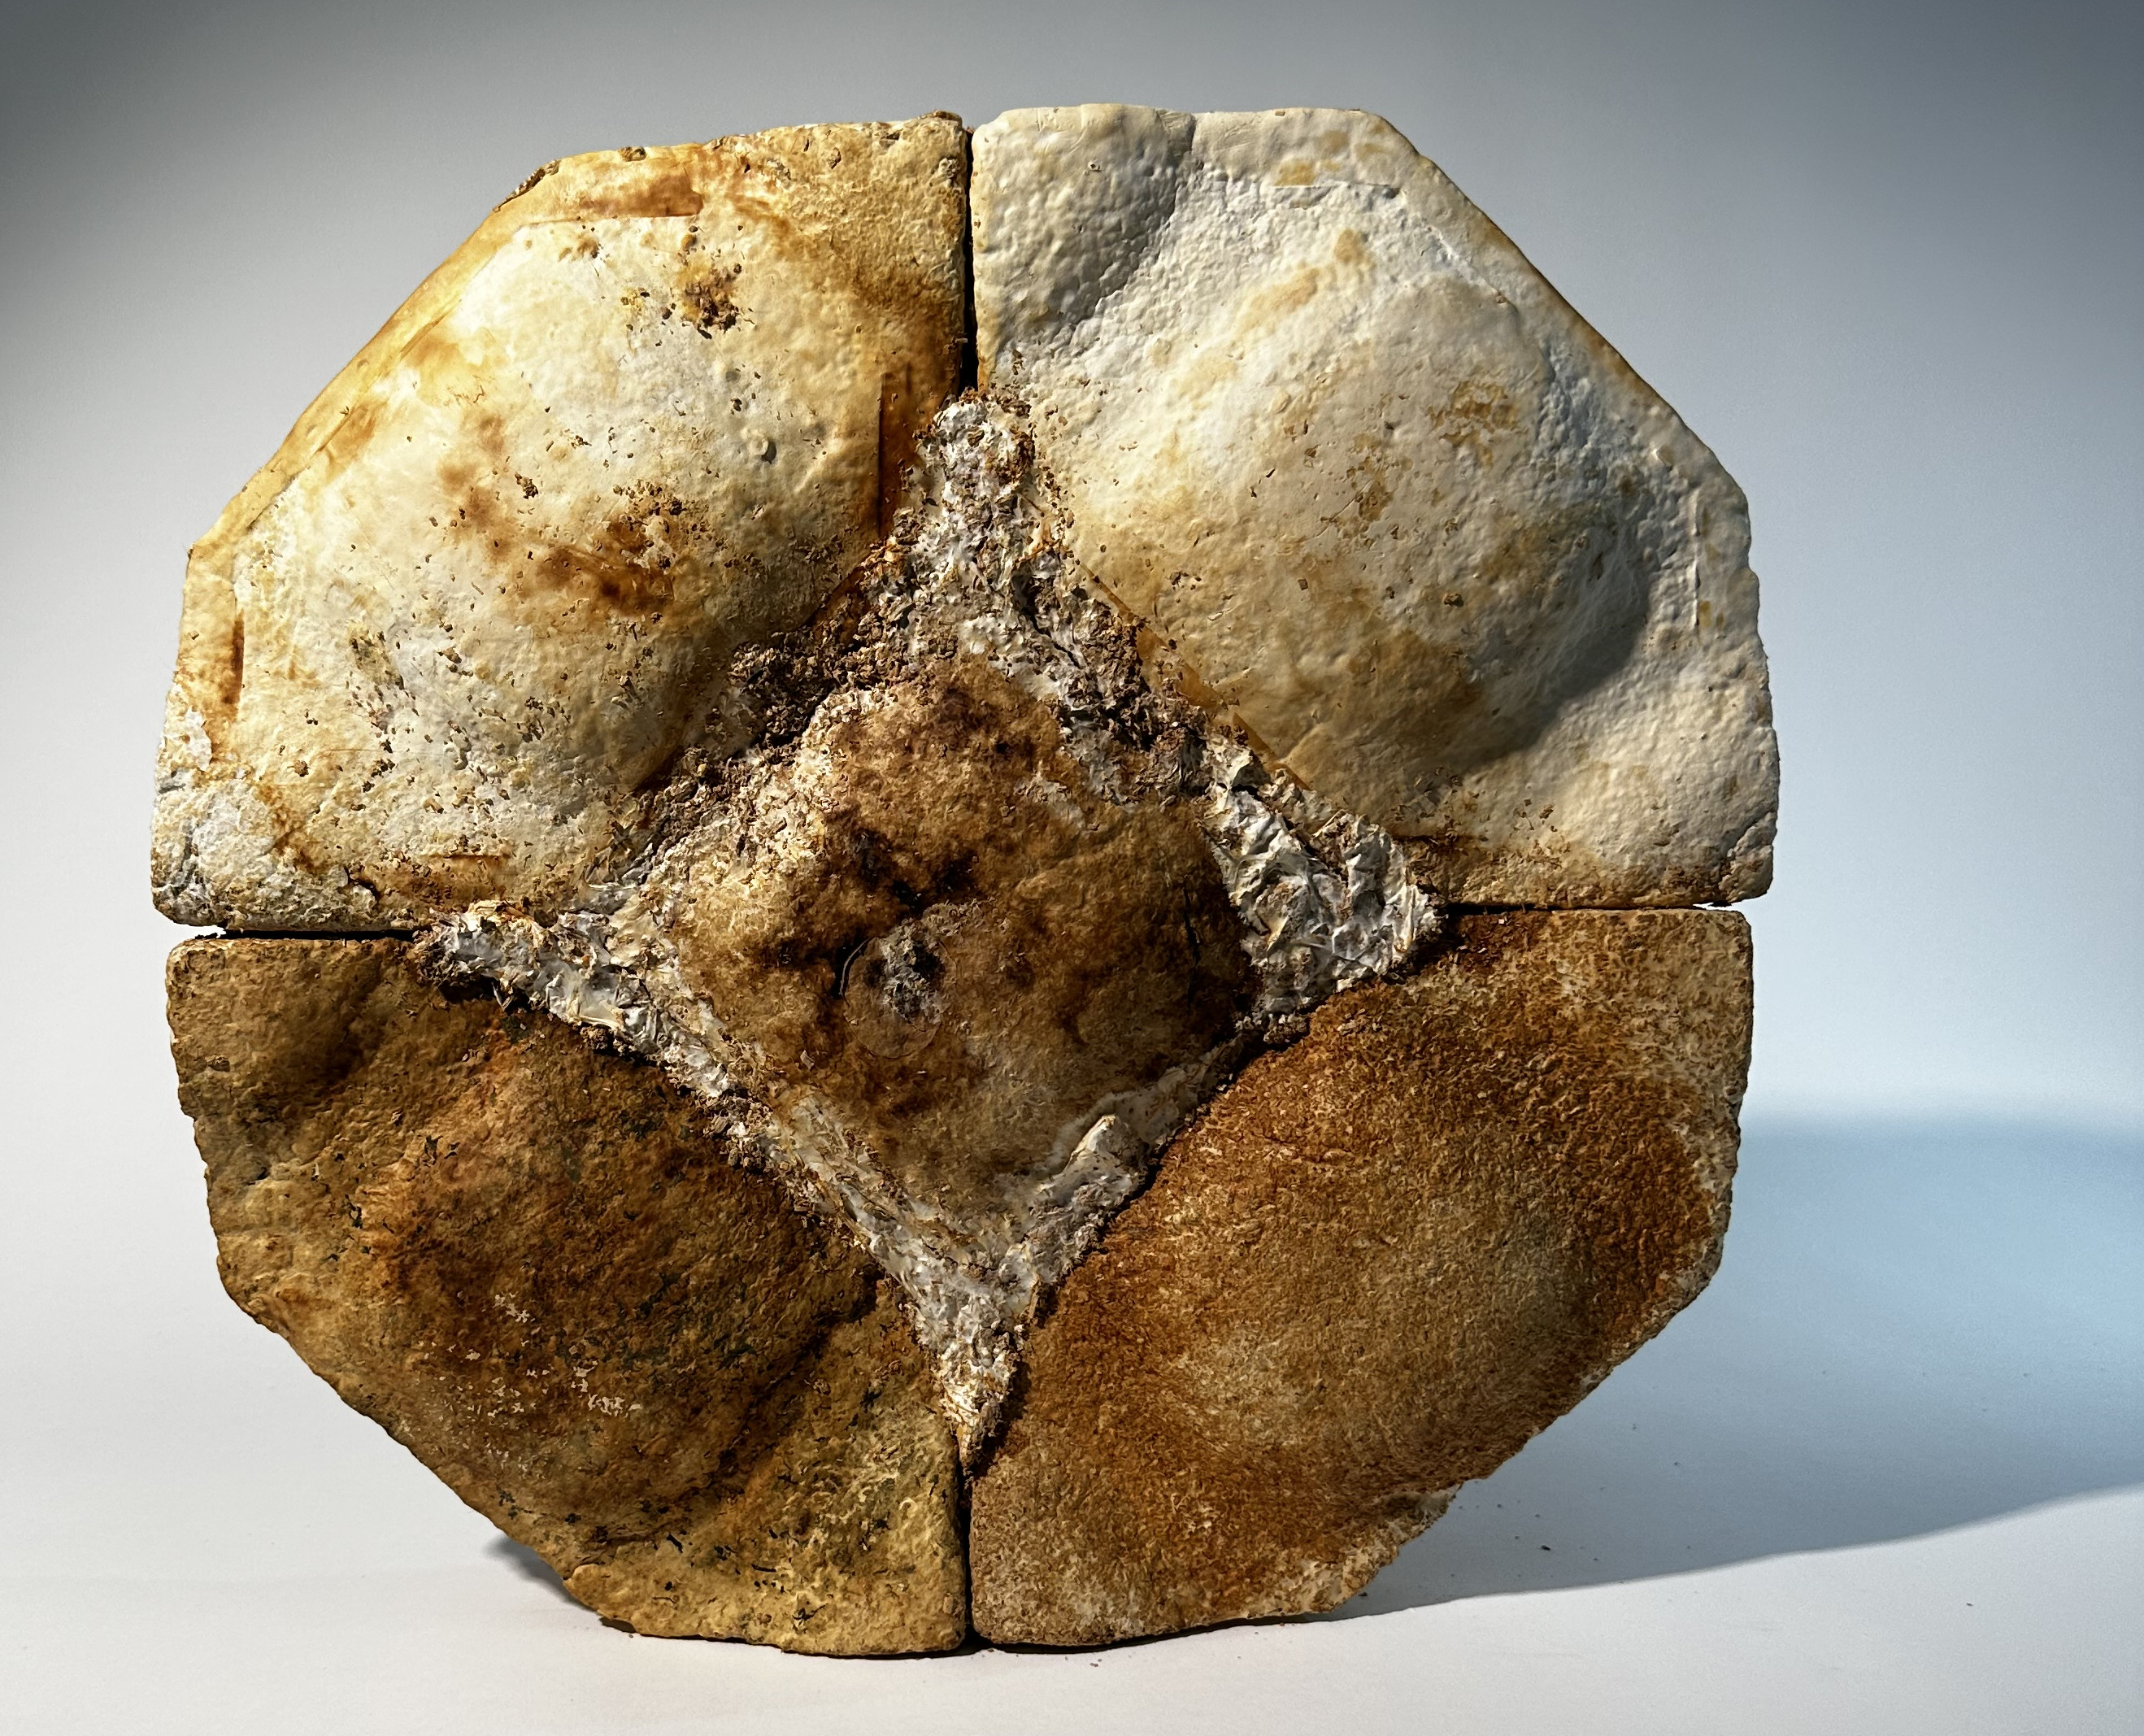
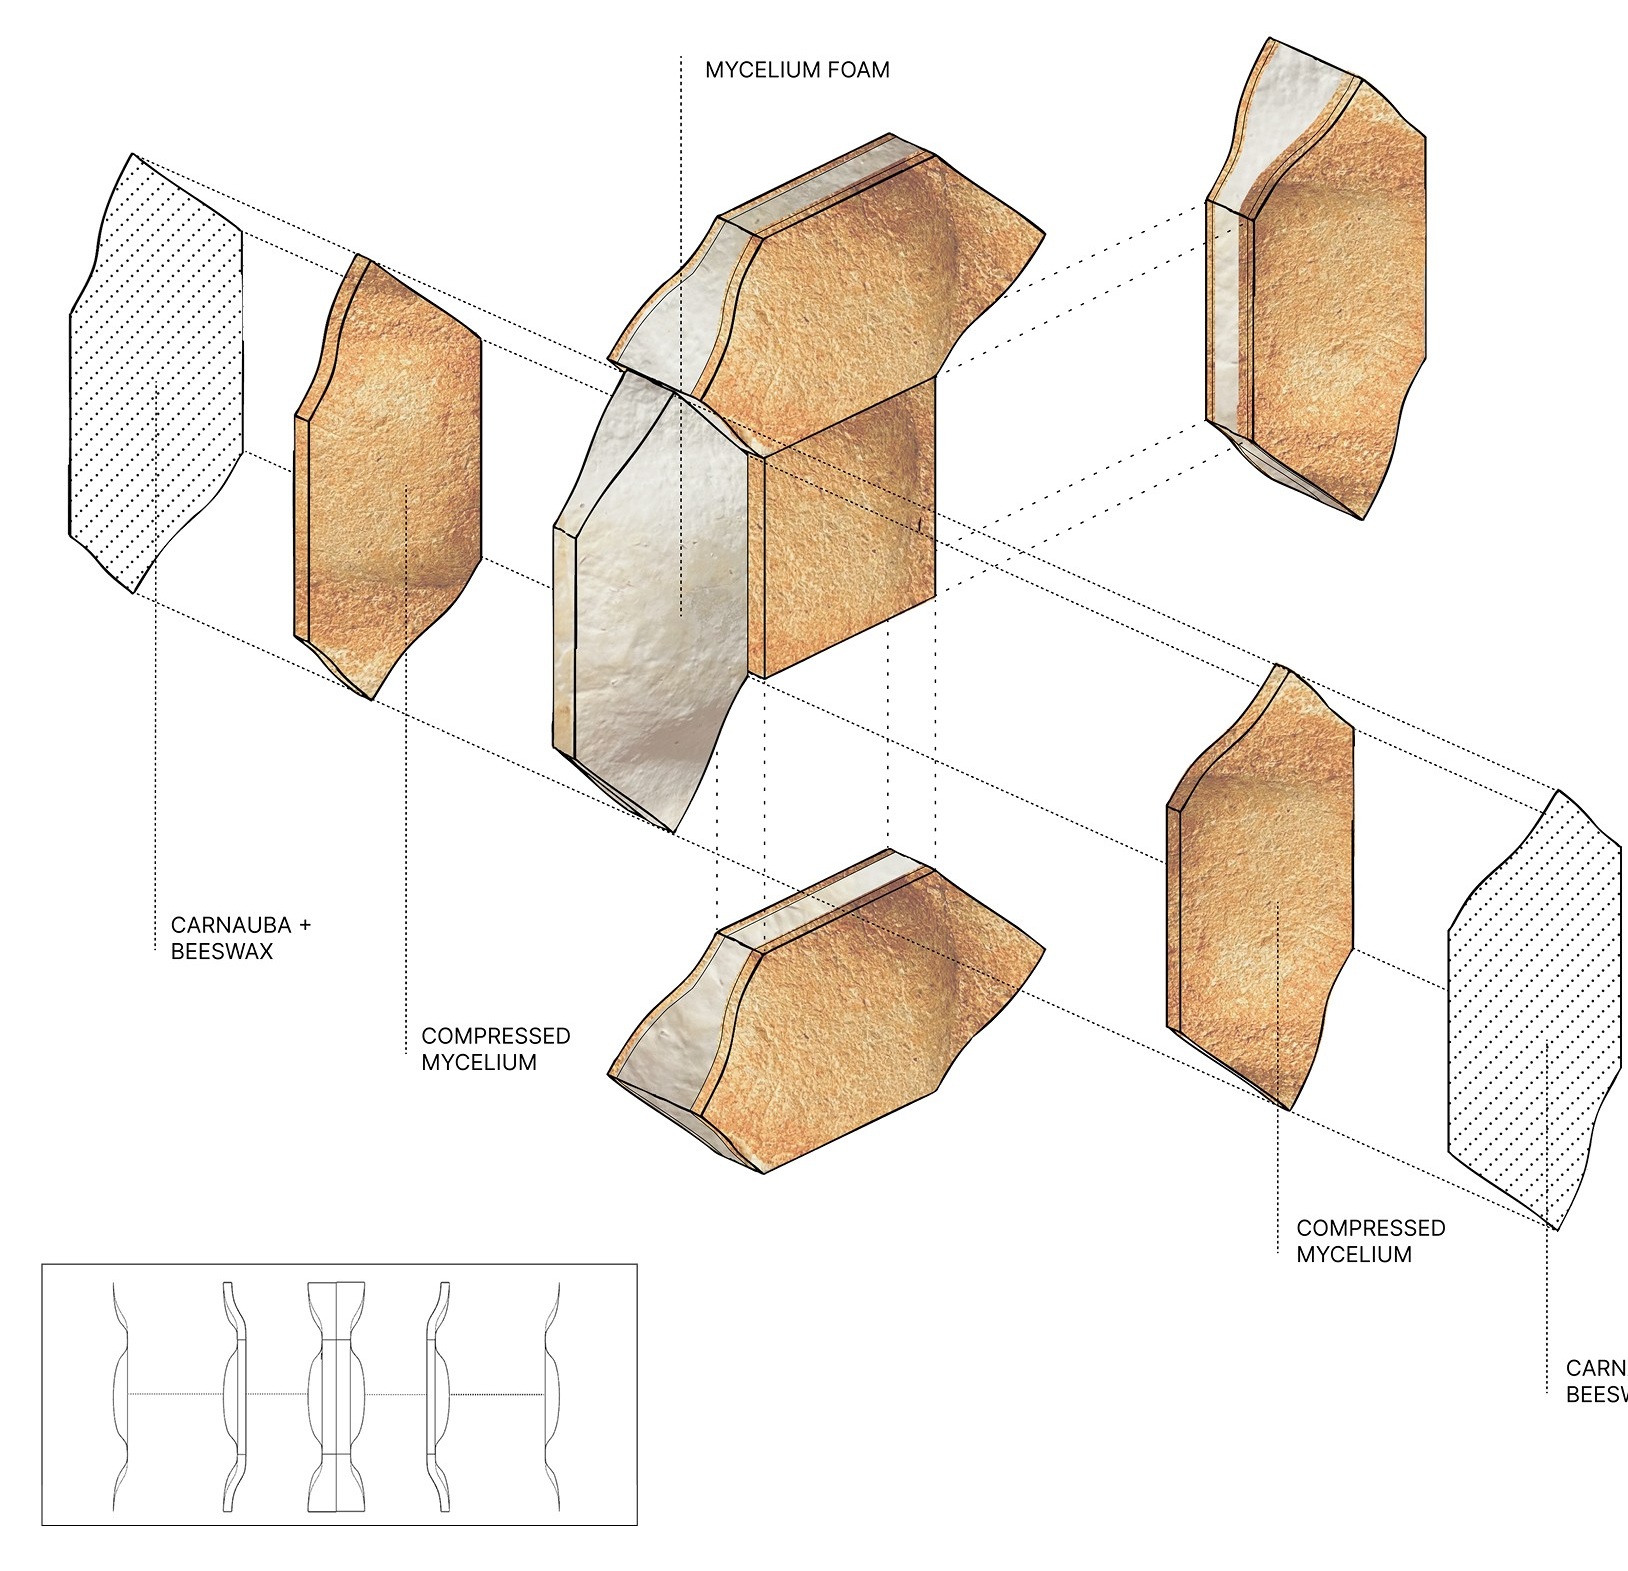
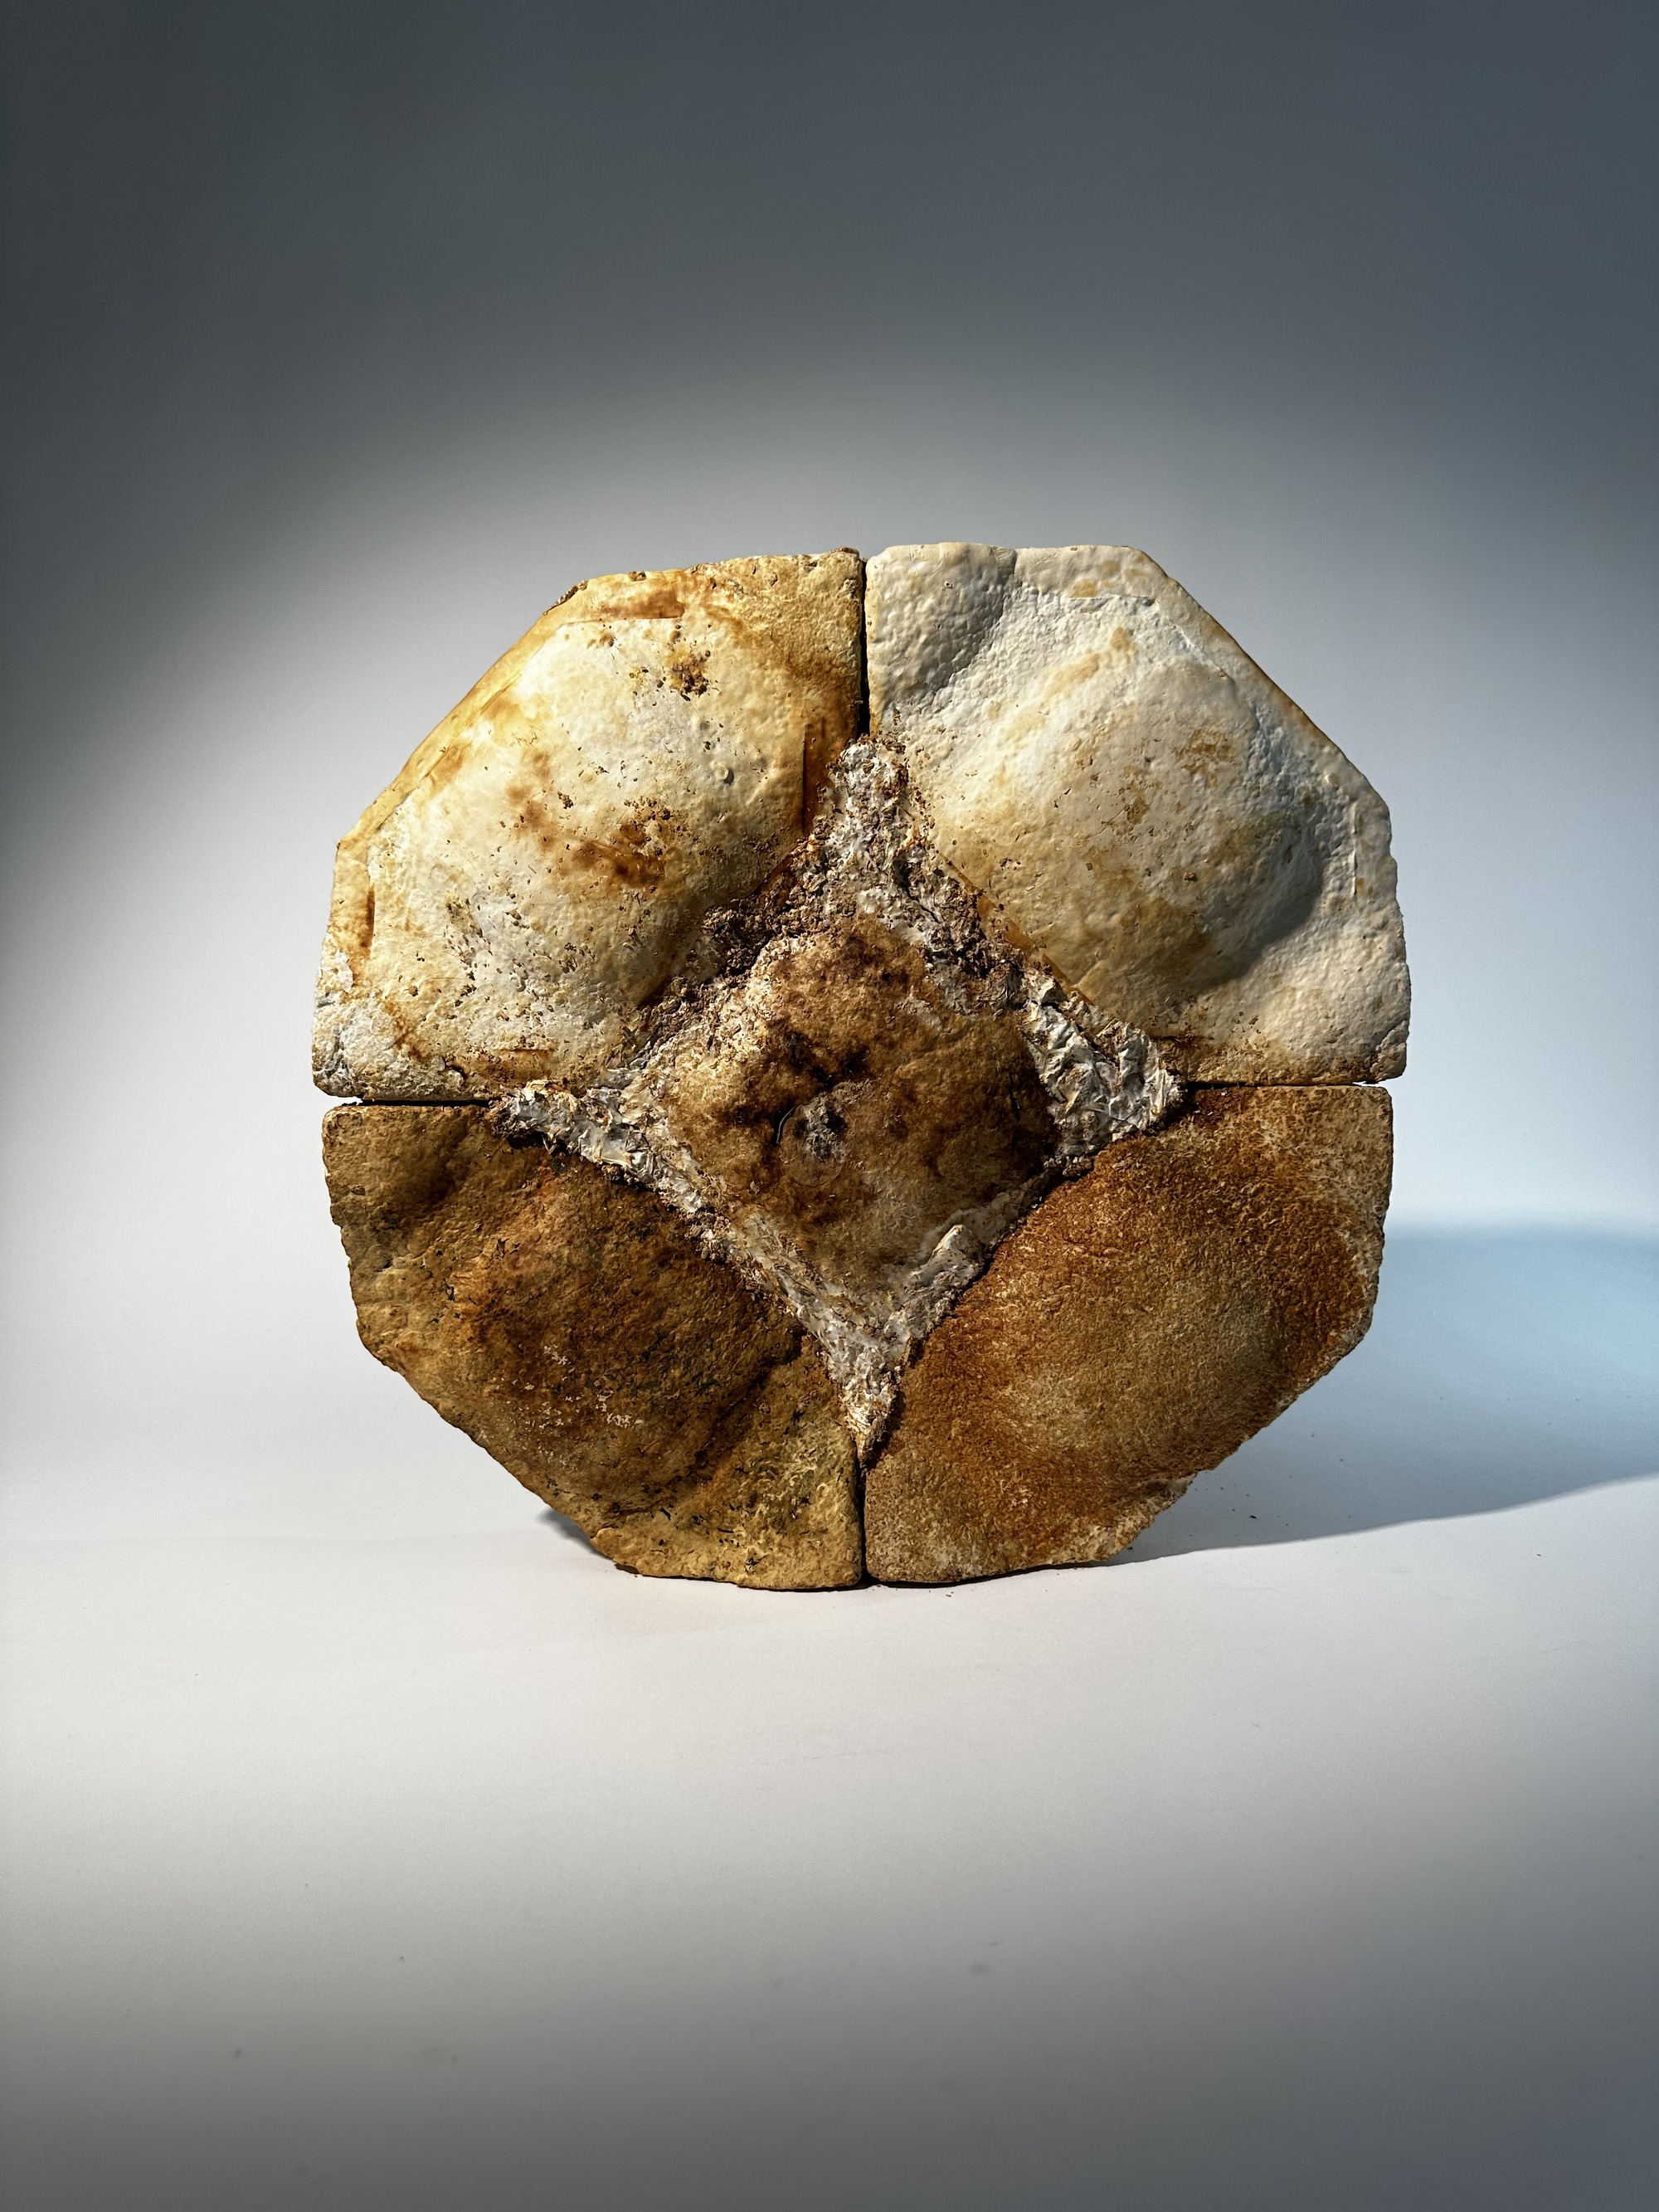
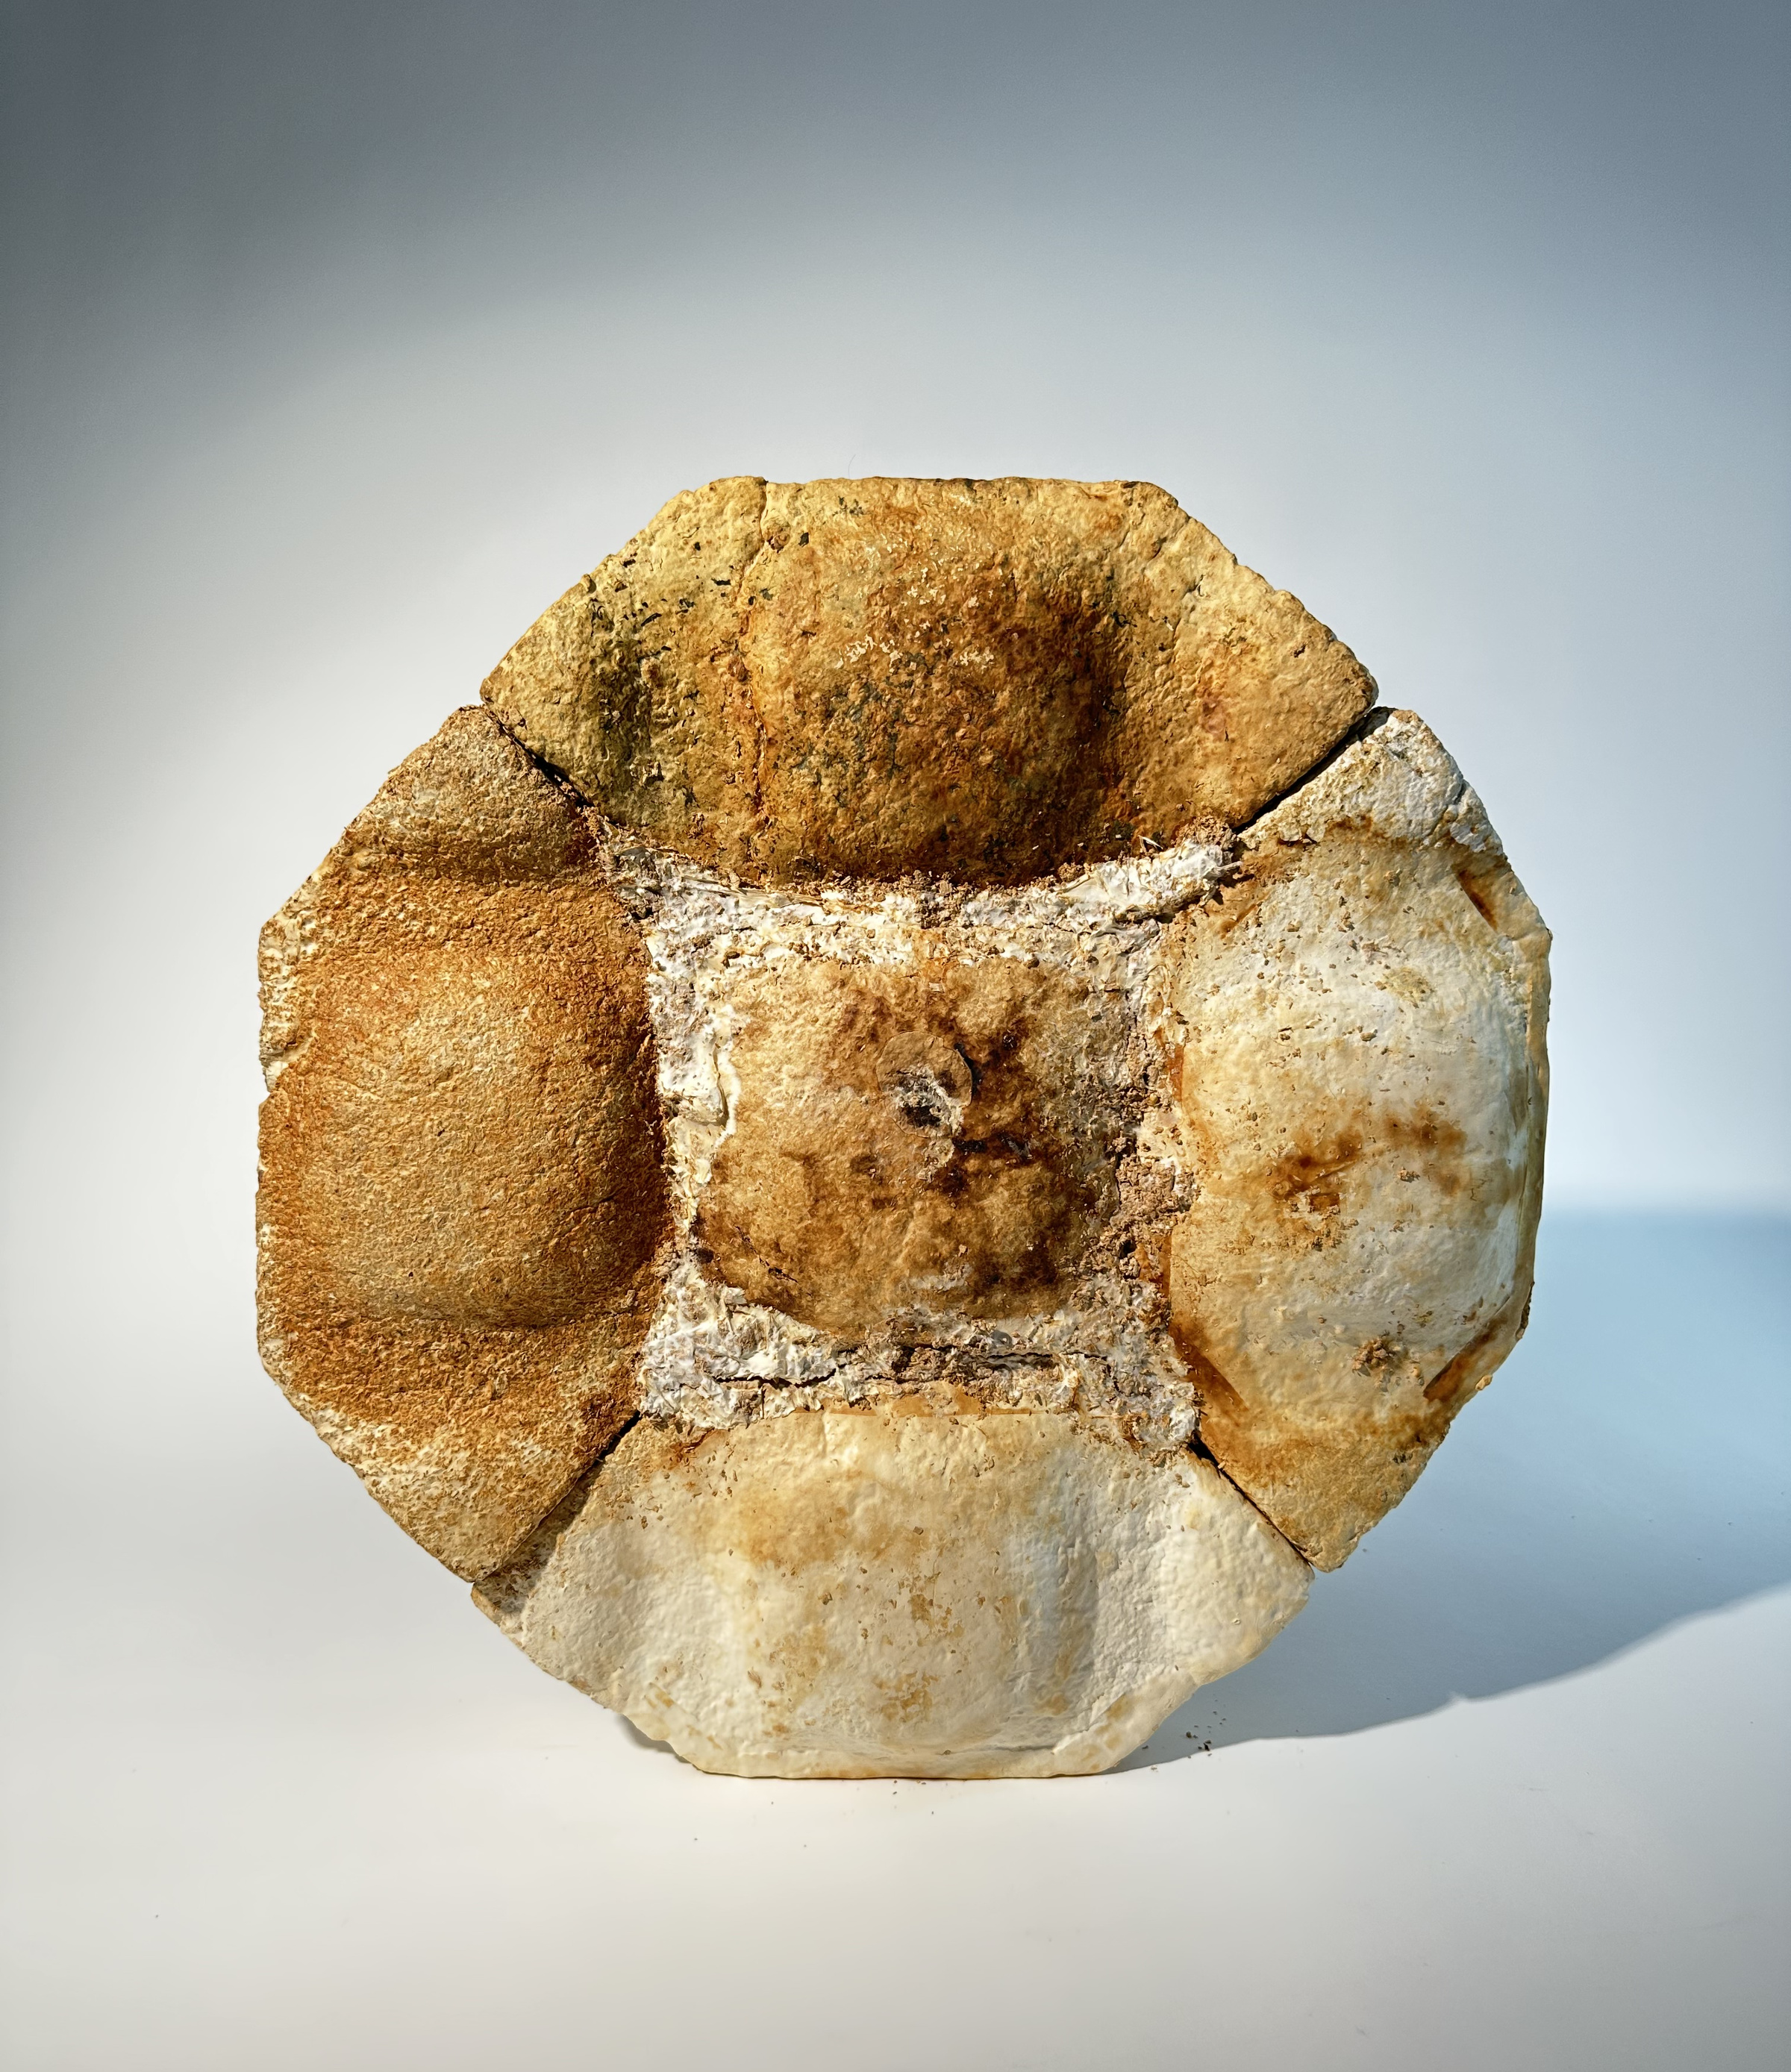
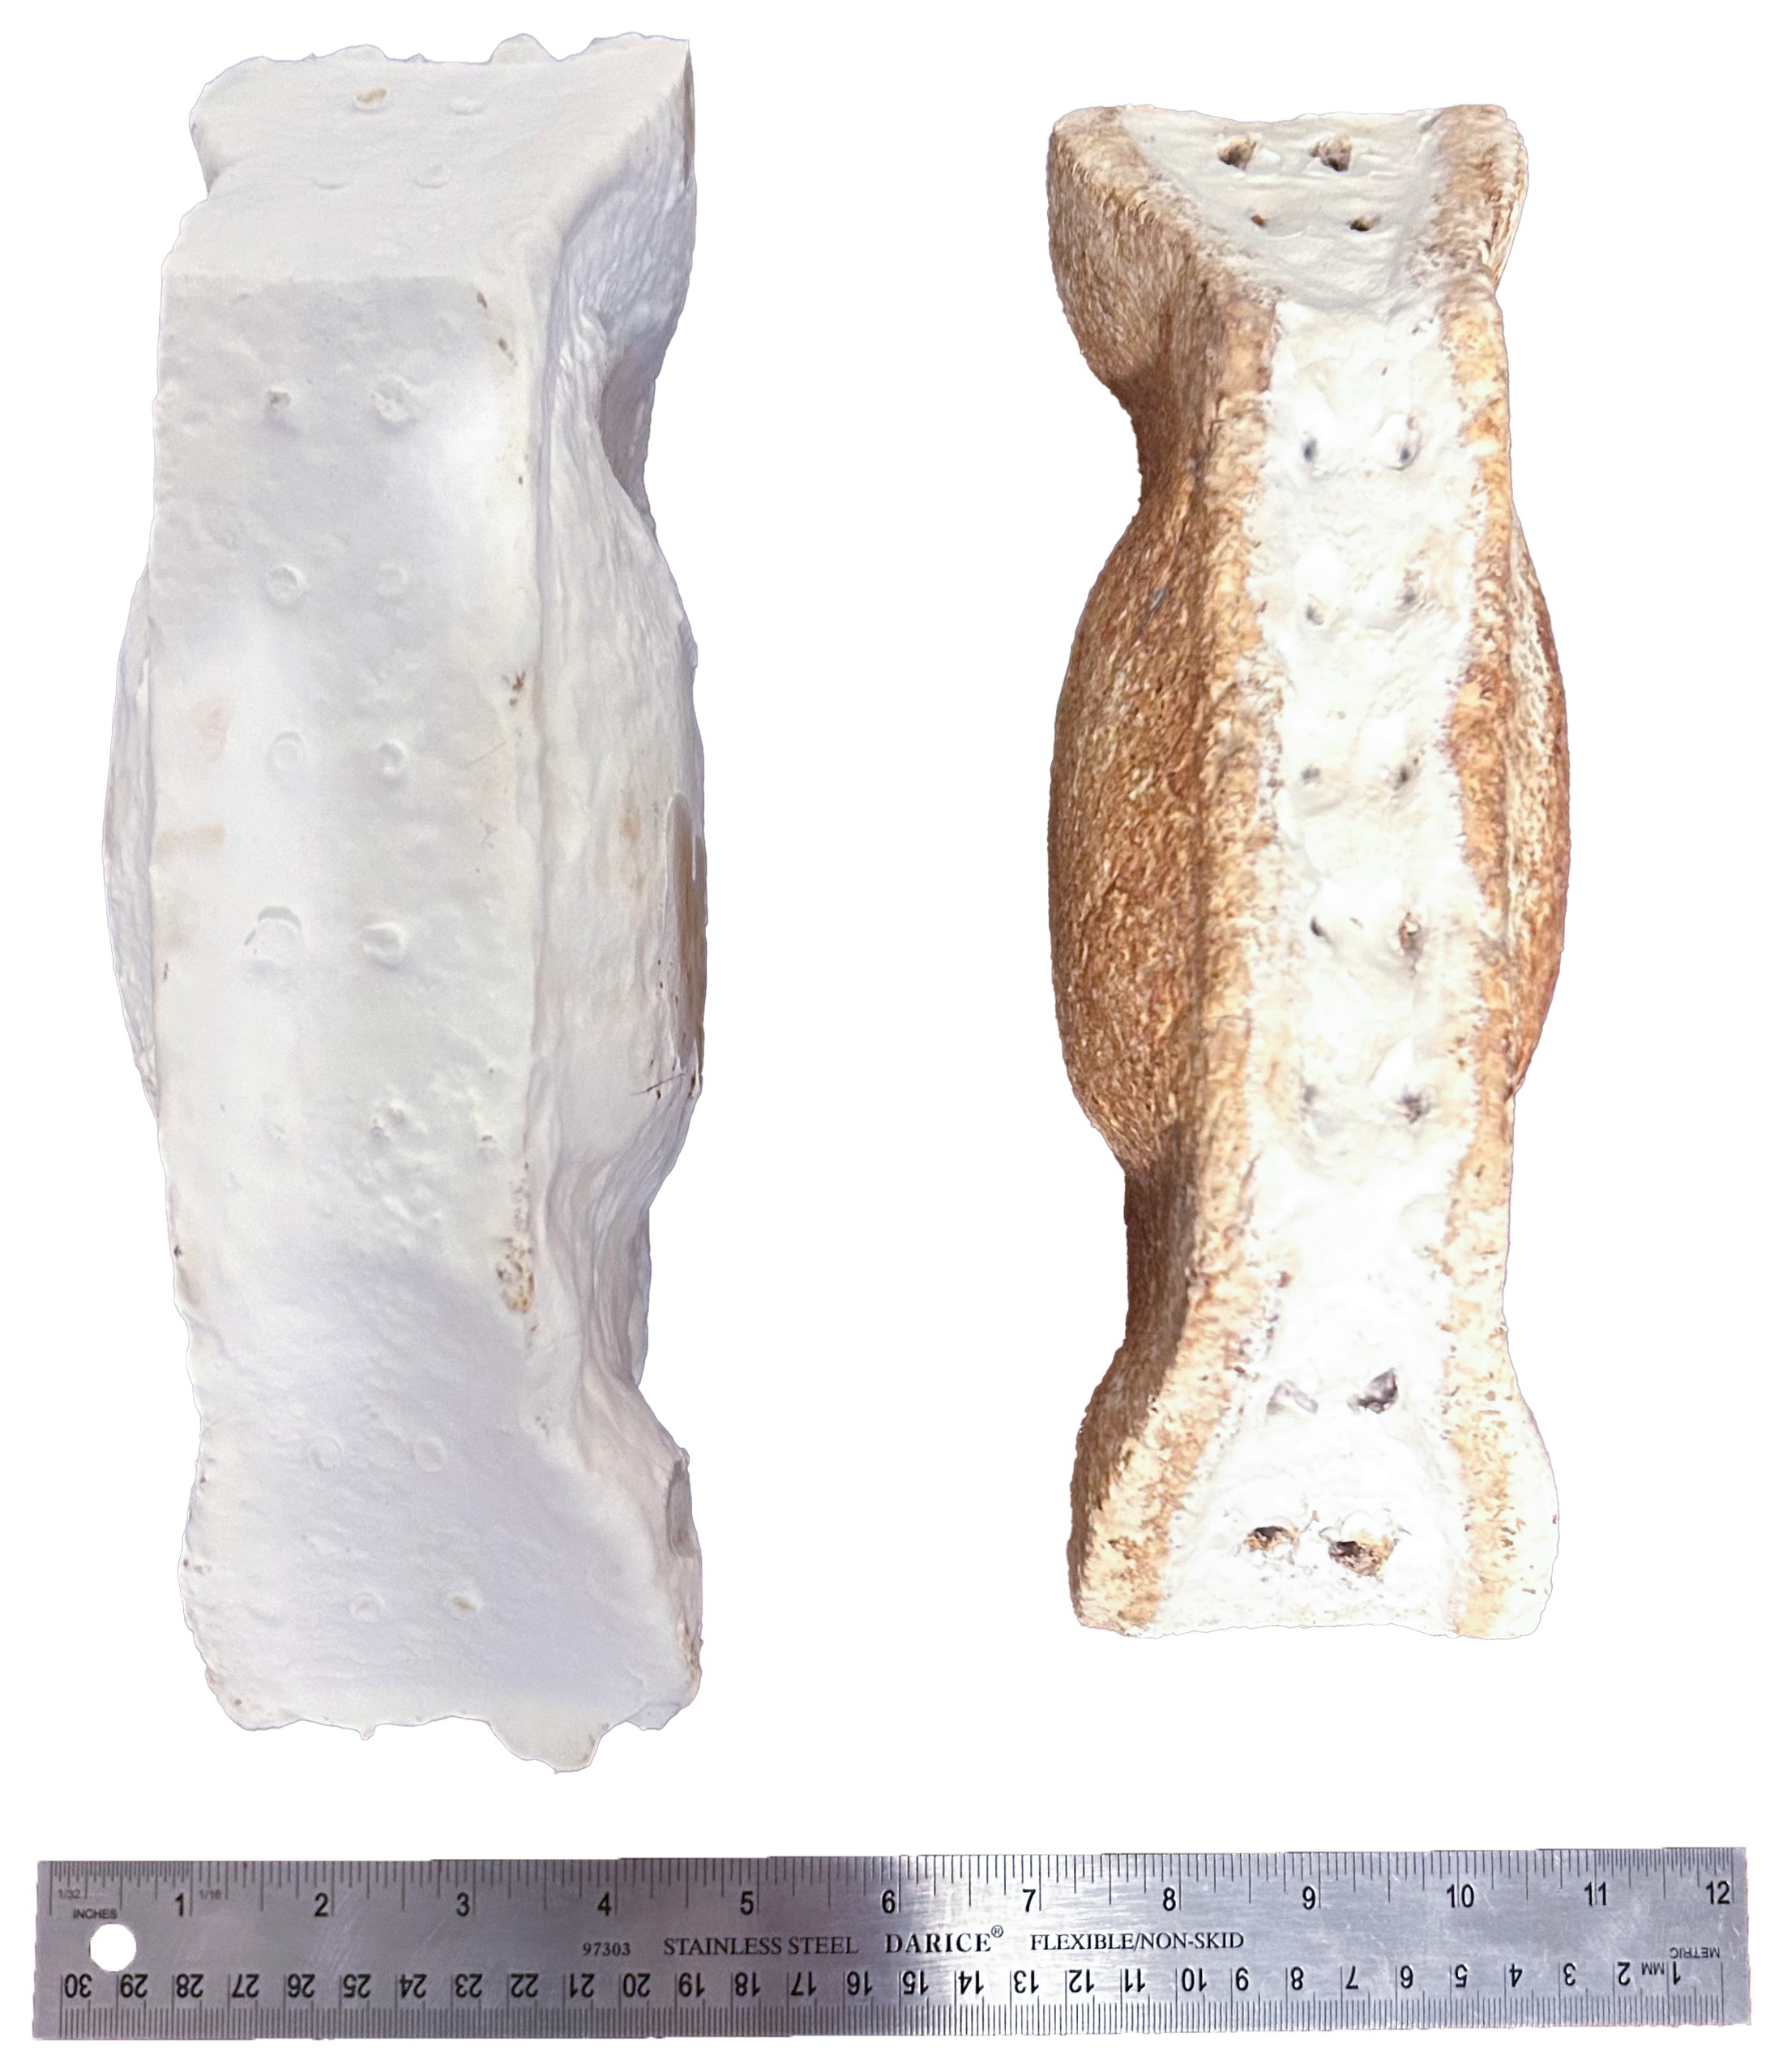
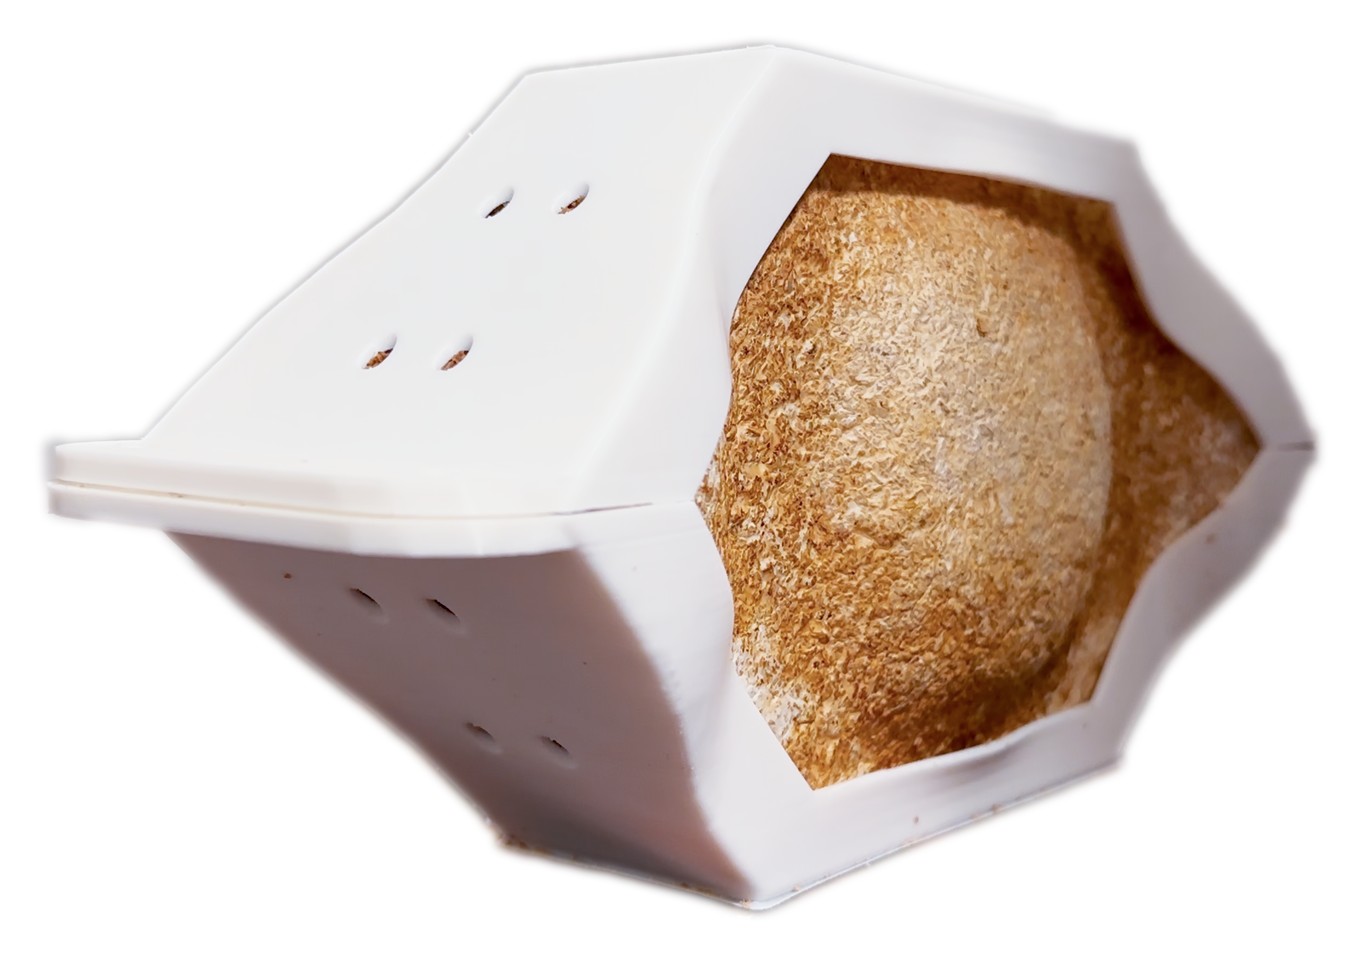
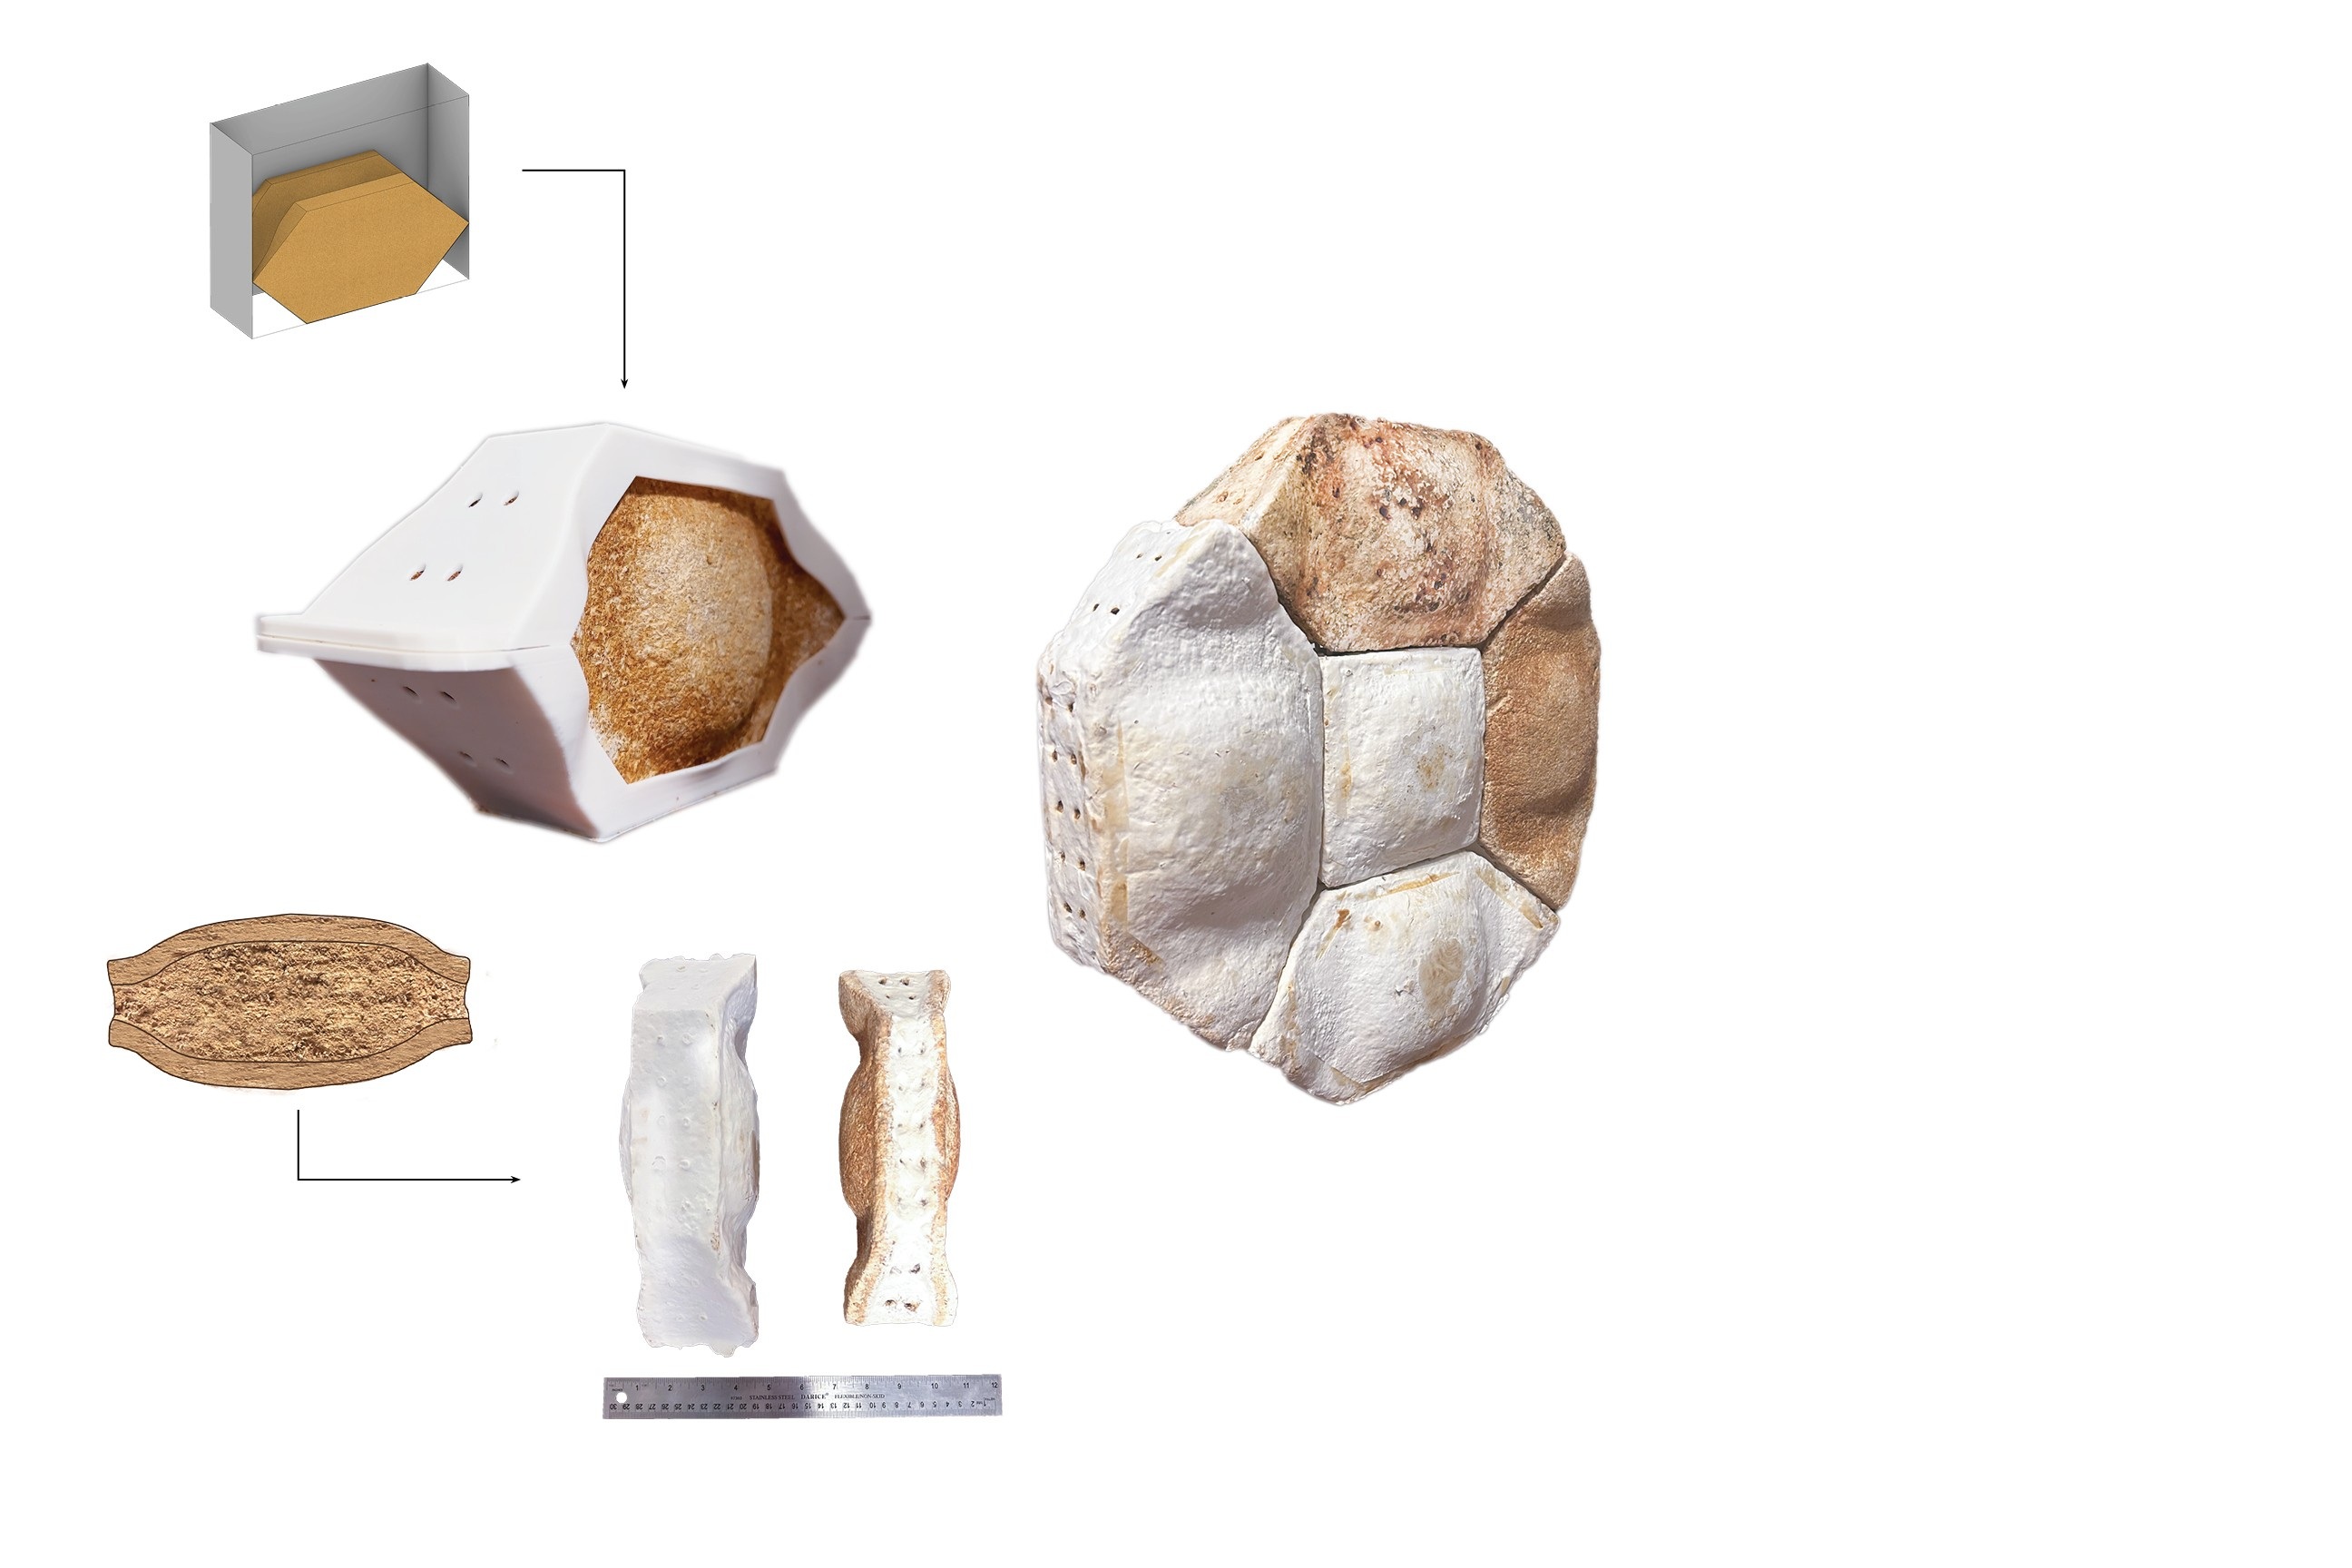
Each block is a sandwich: two compressed mycelium panels around a core of mycelium foam, coated in carnauba and beeswax. The dense skin carries load and sheds moisture, while the foam core keeps air pockets for insulation. Hexagonal modules tessellate into a wall, with a mycelium corner joint in development. The intent is a product that is entirely biodegradable.

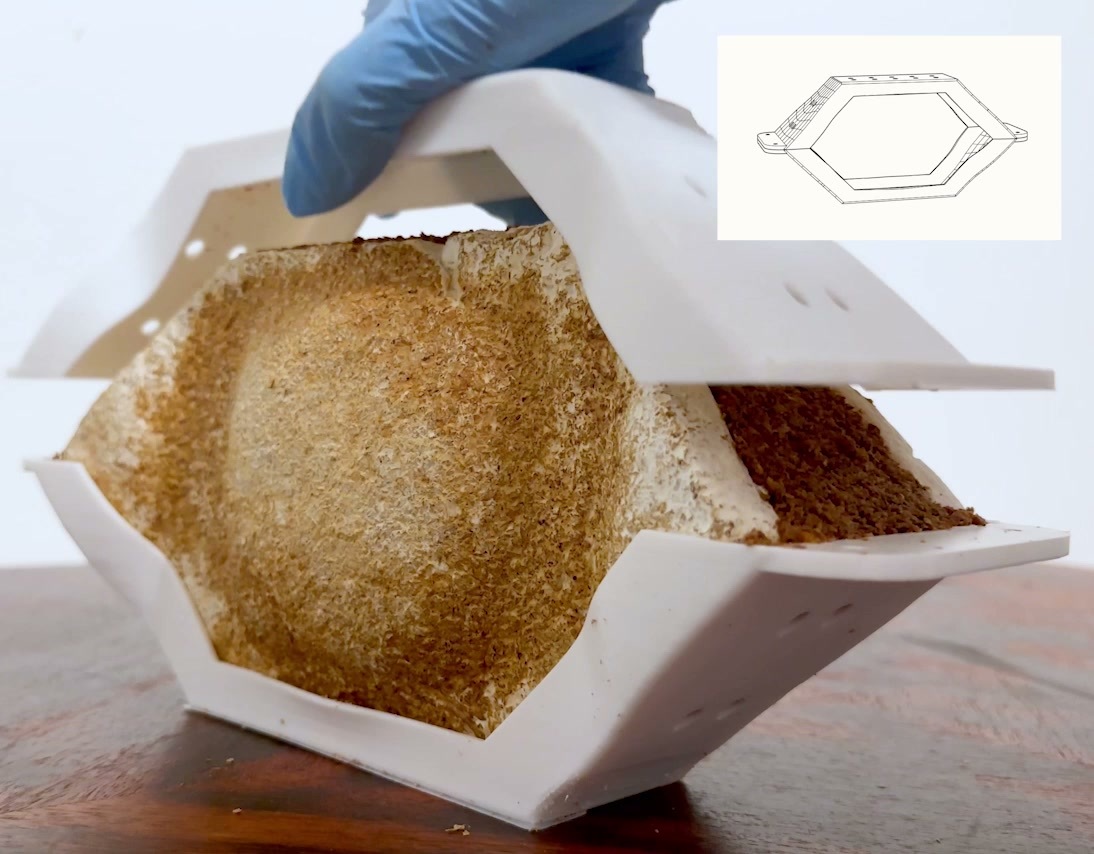
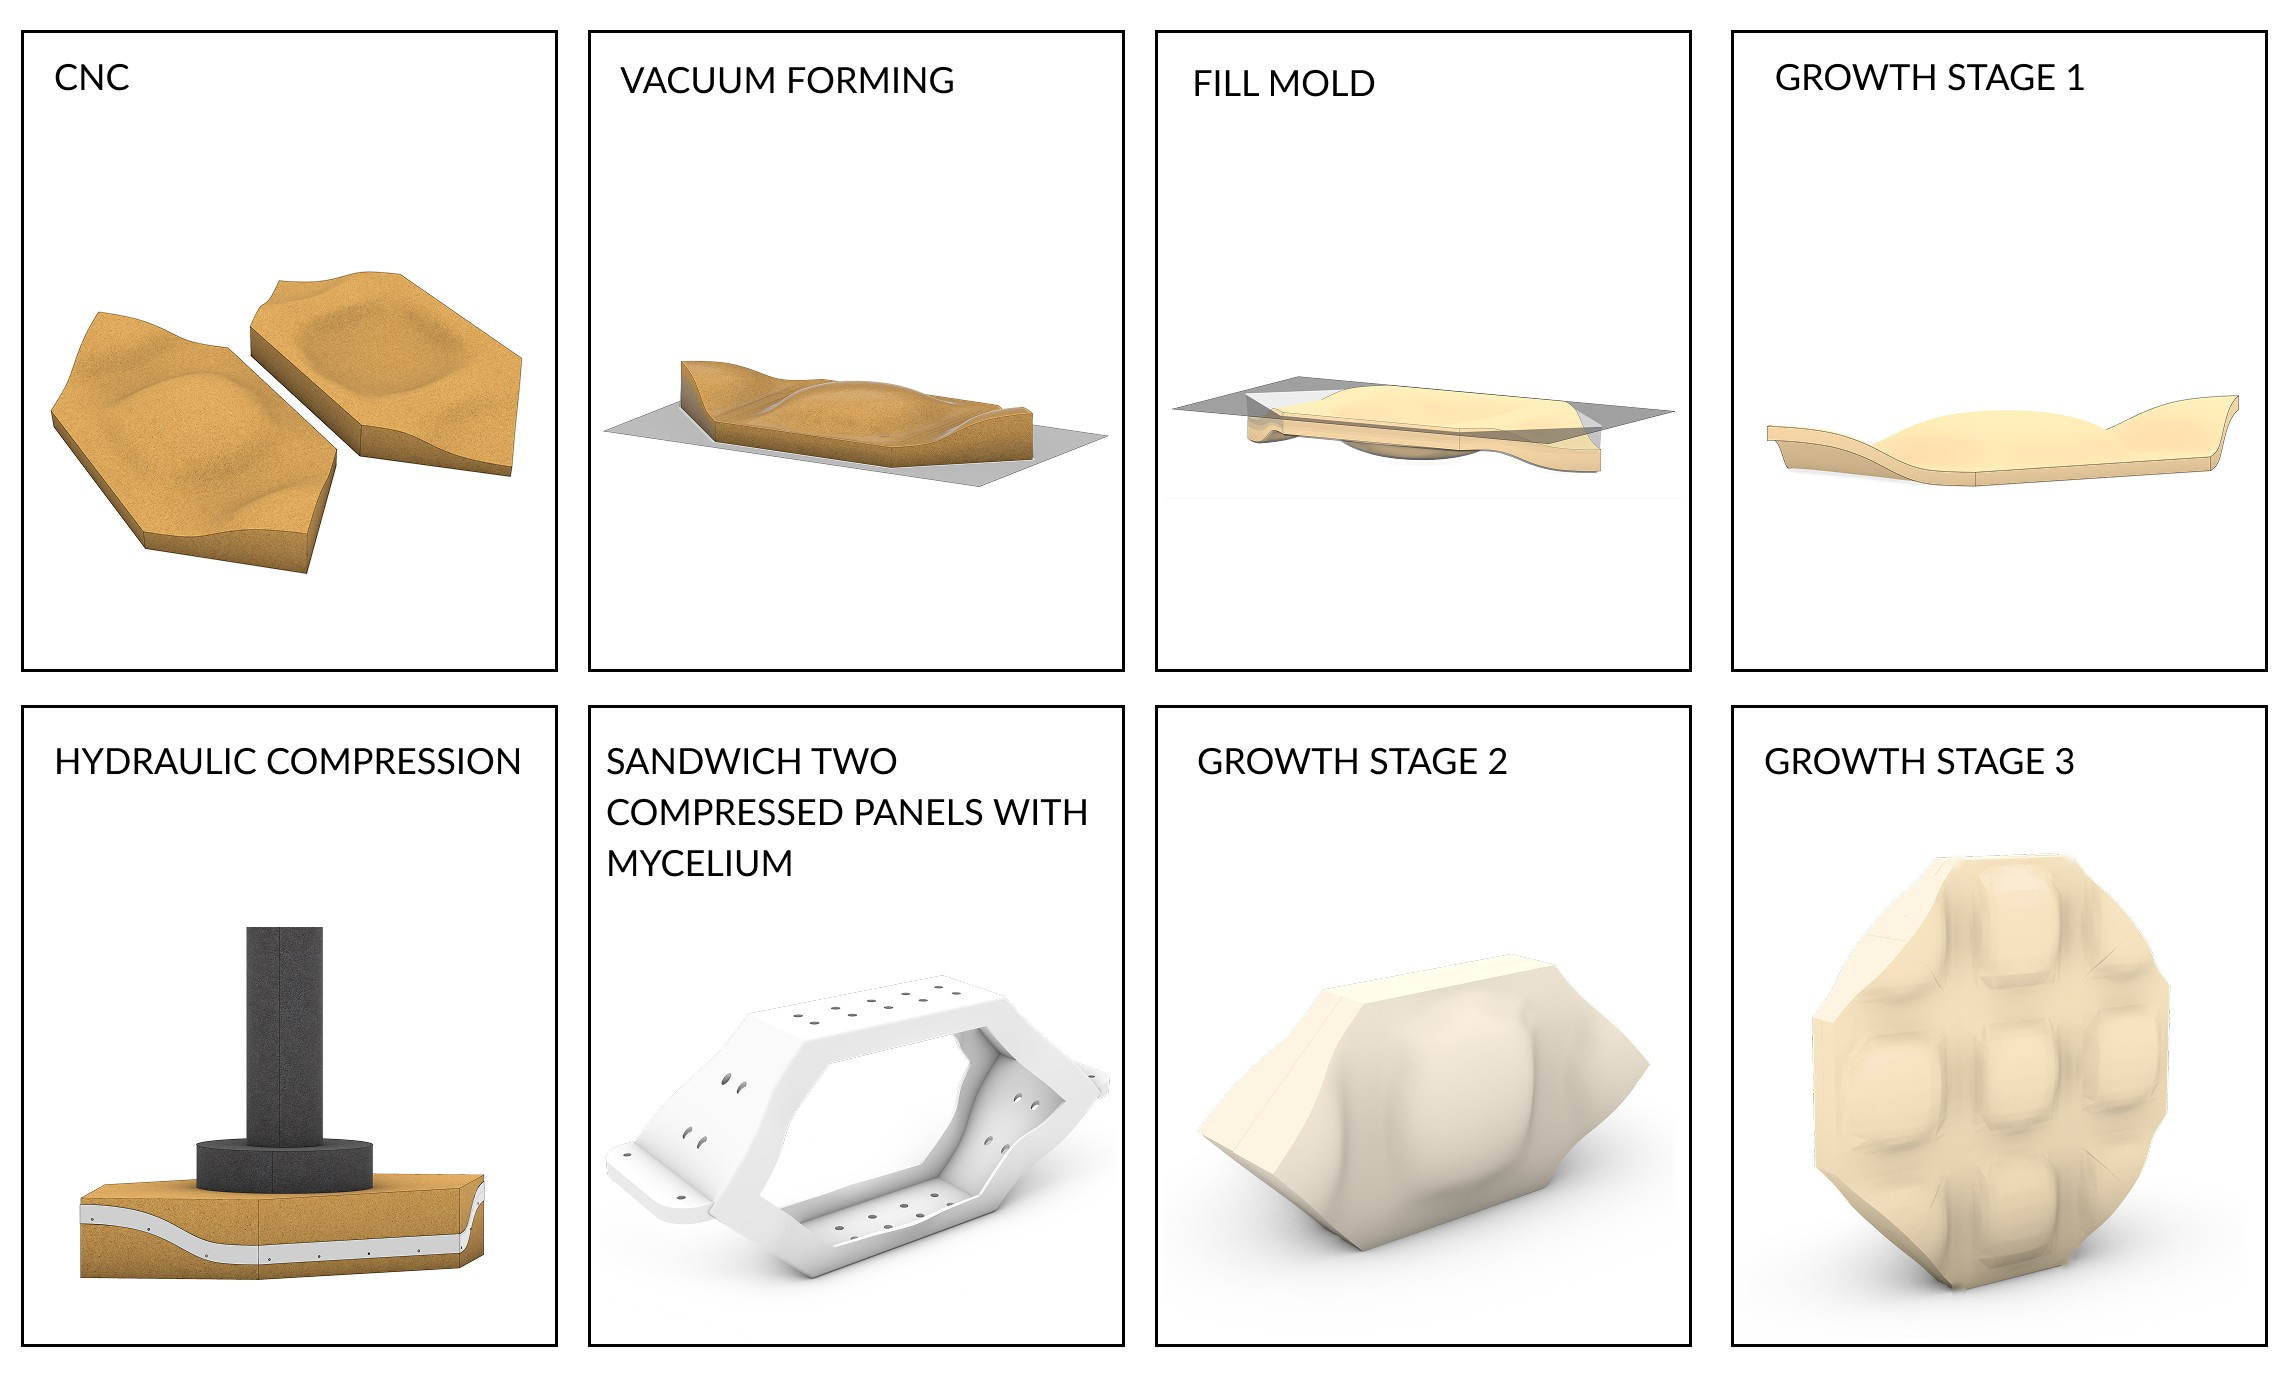
Panels are grown in vacuum-formed molds cast from CNC-milled positives, then compressed in a hydraulic Carver press at 2 to 4 metric tons, held for about 10 minutes and reapplied as the material loses height. A parafilm layer prevents sticking and gives consistent panels of roughly 0.8 to 0.9 cm. Panels left too long before pressing dry out and crack, so moisture control is critical.

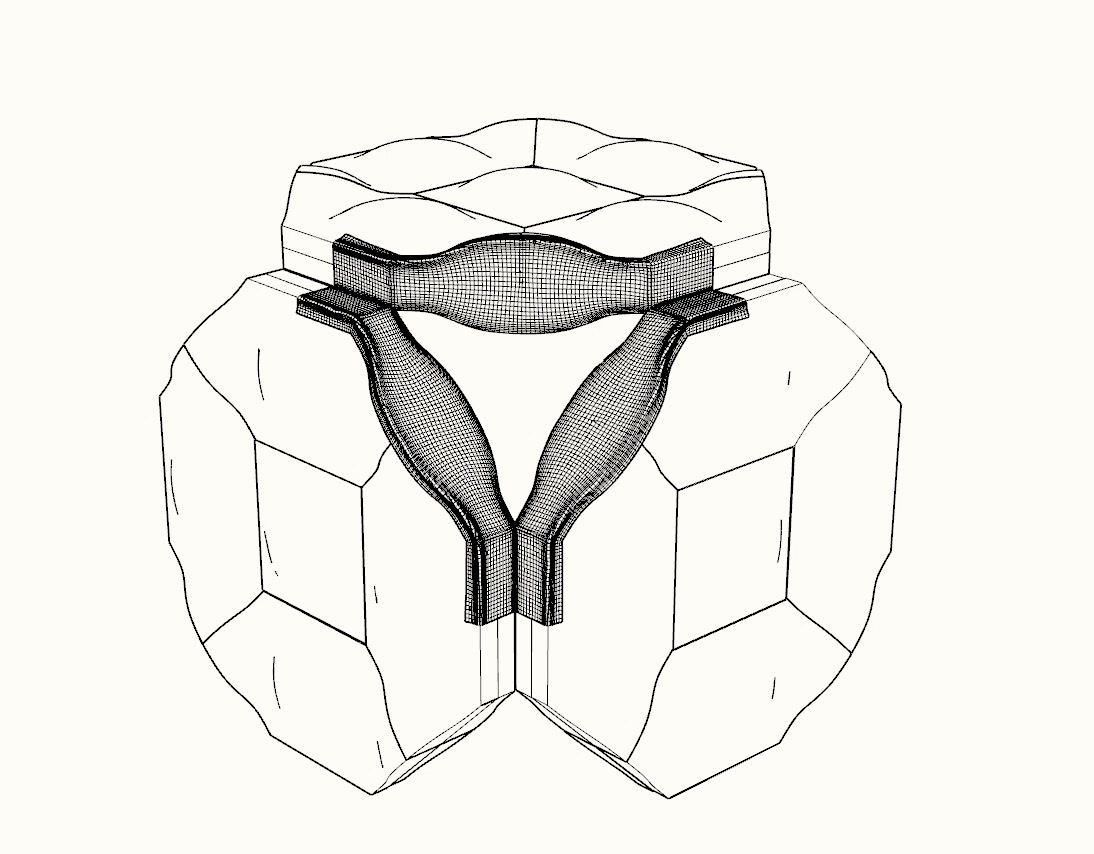
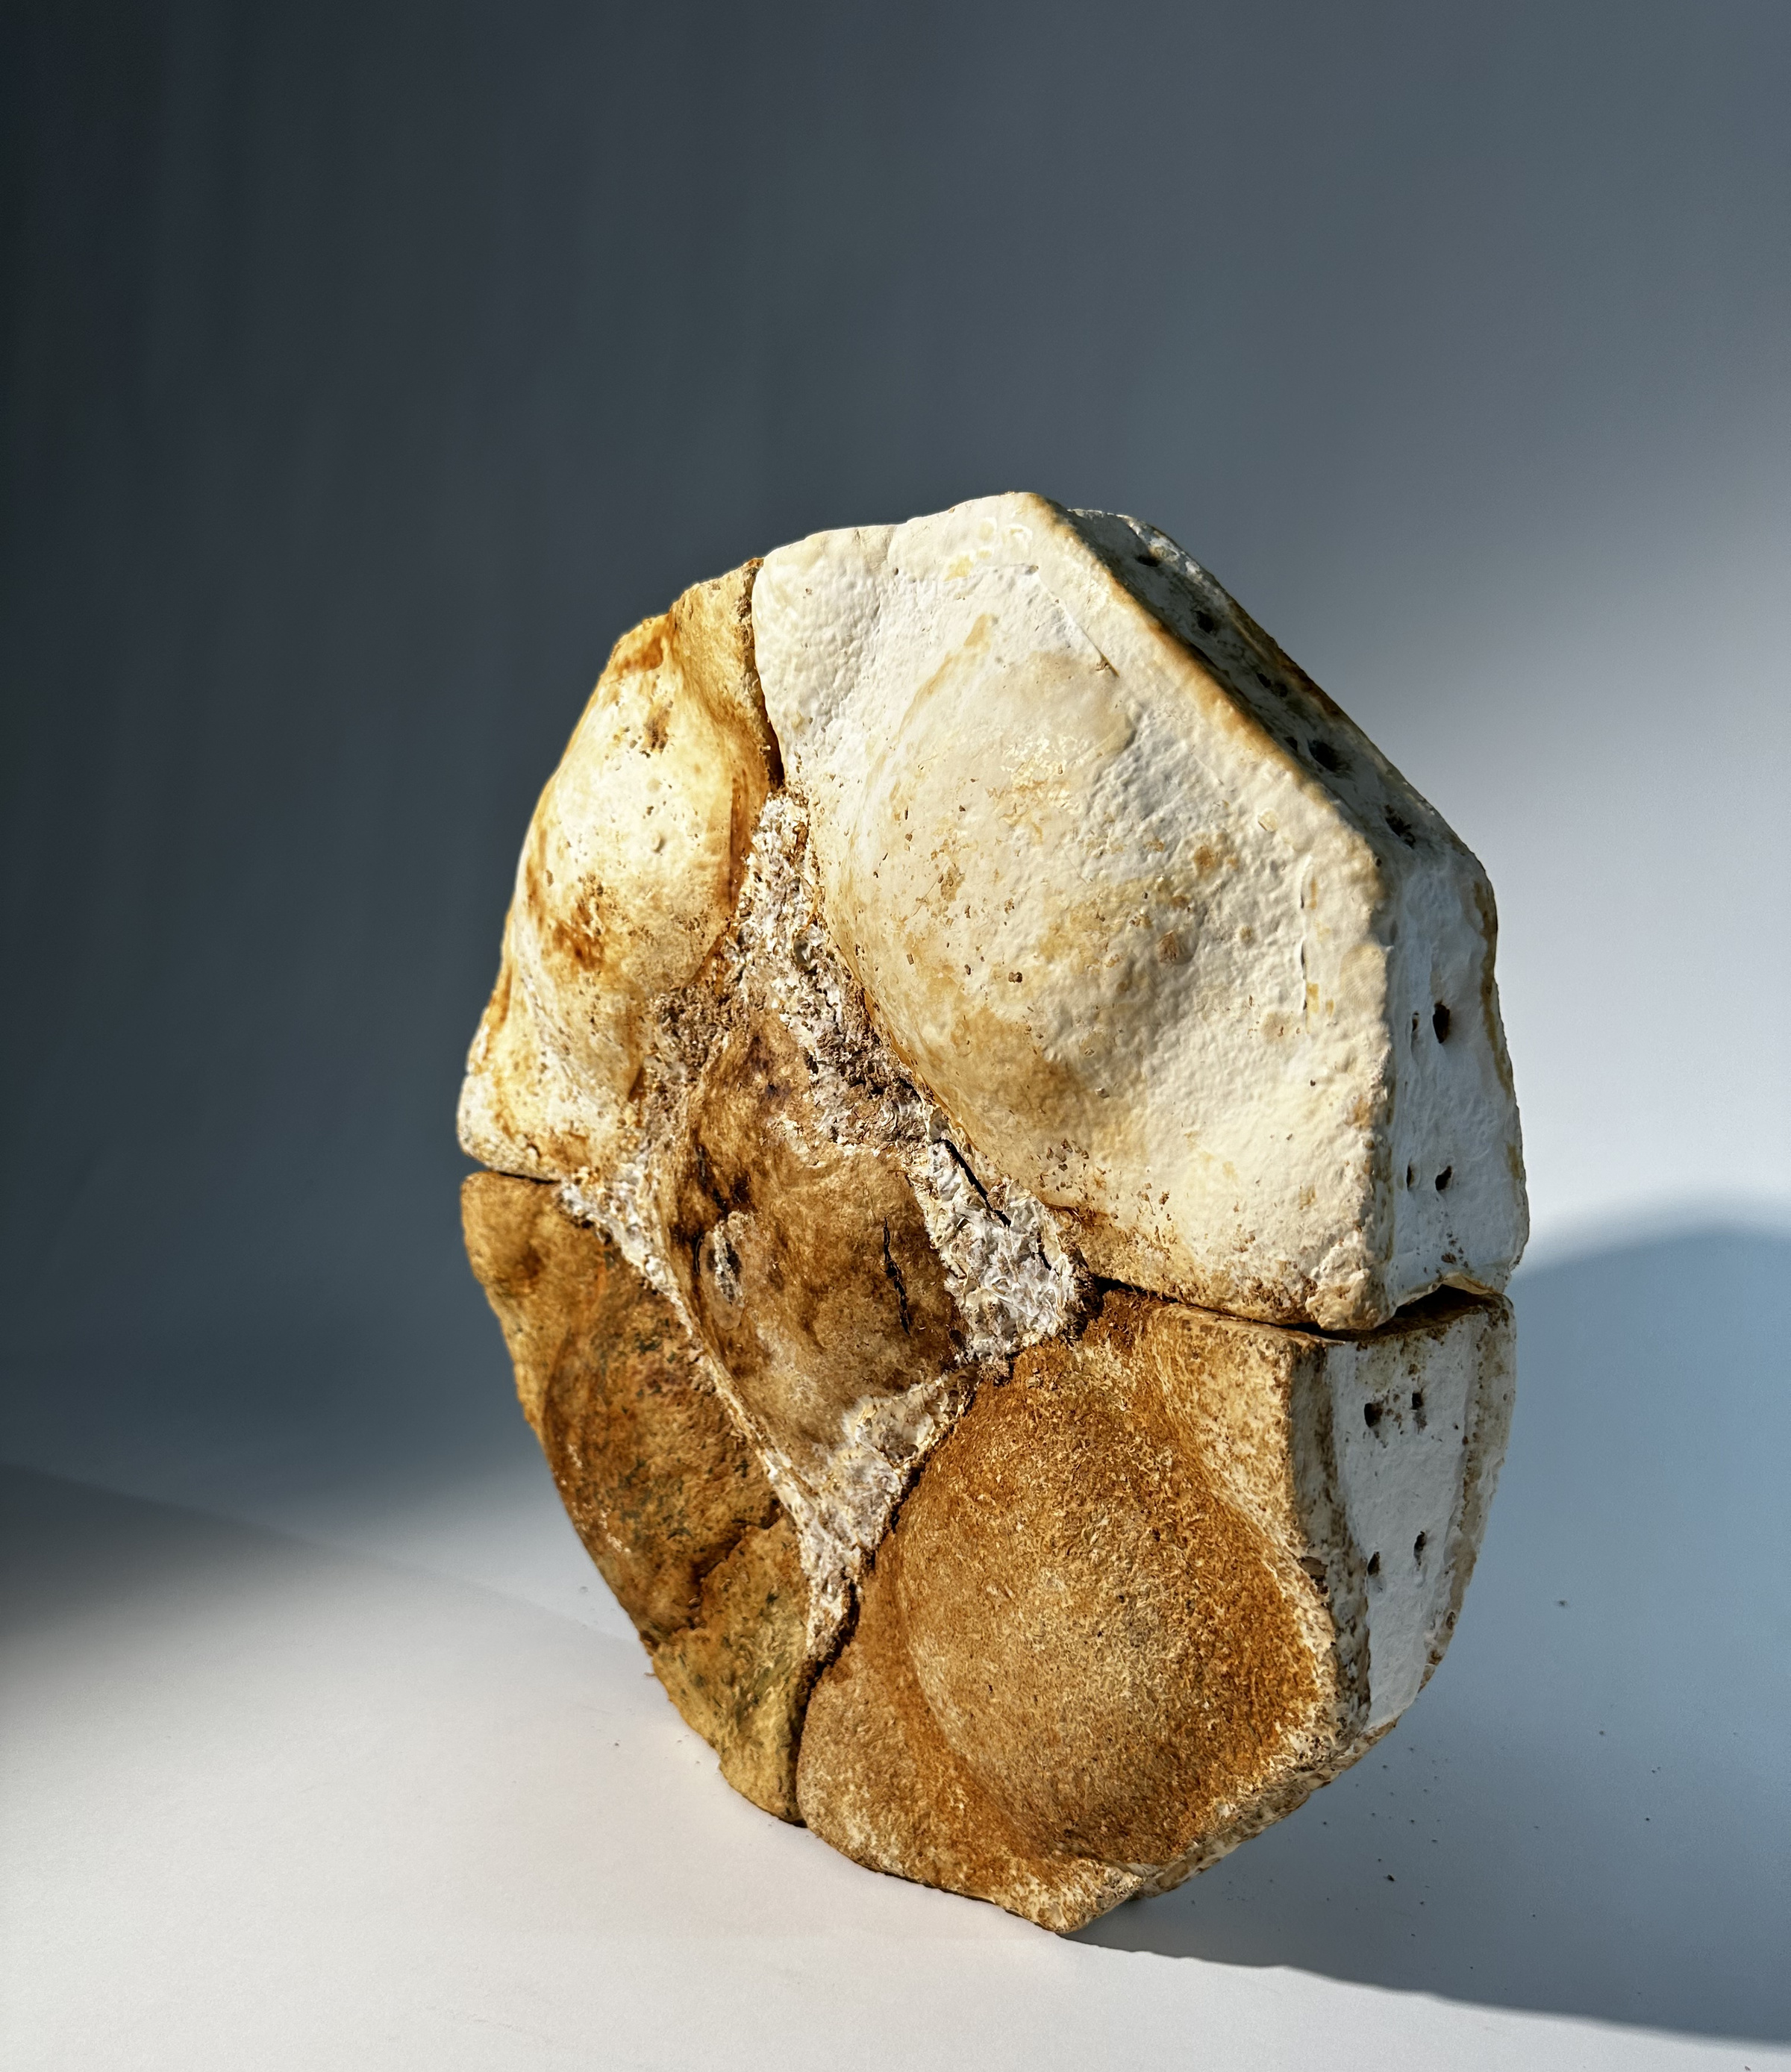
A custom 3D-printed fill jig aligns the panels and introduces new growth at the joints. Assembling early lets the panels fuse before final drying, and dowels add mechanical reinforcement to the material bond. Live blocks run about 14% larger than dry ones.

Next: a new fill shape with a void that leaves room for “grout,” and more molds running at once to improve growth timing. Wax finishes with glycerin are being tested for water resistance.

Multi-density myco-block, finished
Multi-density myco-block: compressed mycelium skin around a foam core, with a carnauba and beeswax coating
Fabrication sequence, from CNC molds to the grown and assembled block
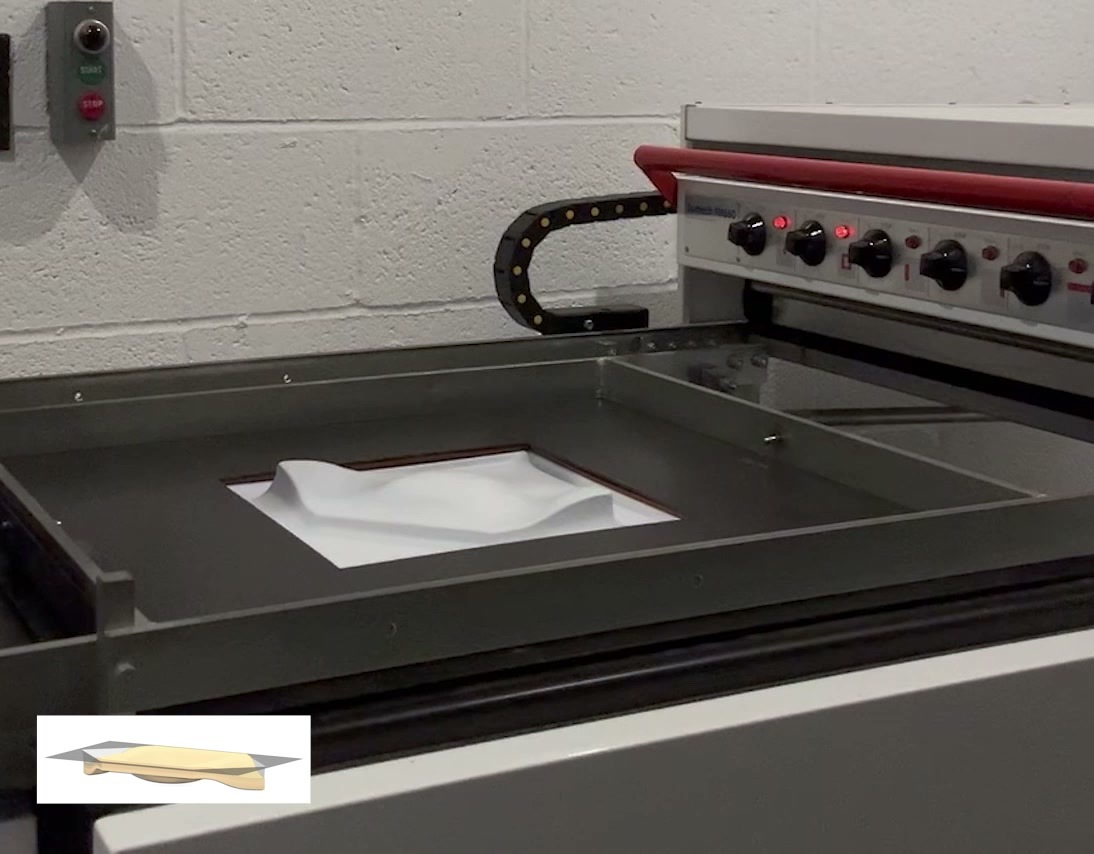
Vacuum forming the mold
Hydraulic compression of a panel
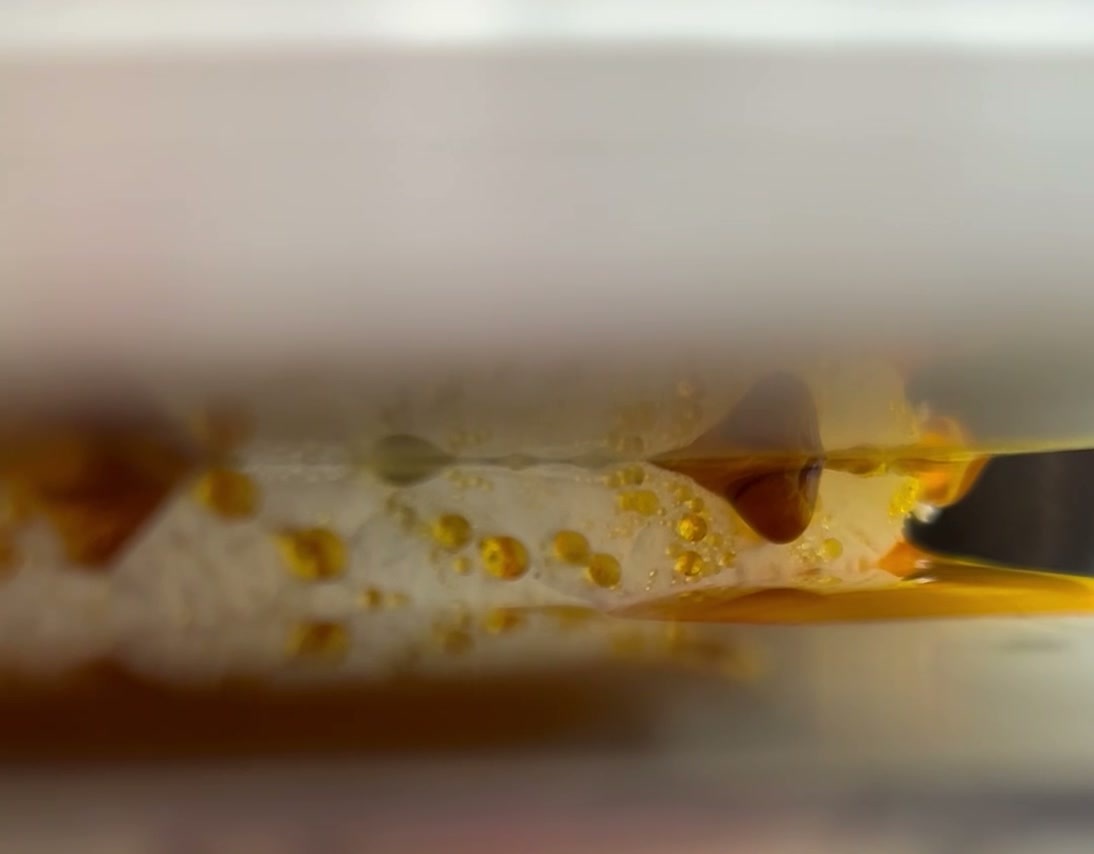
Foam fill: the ice cream sandwich
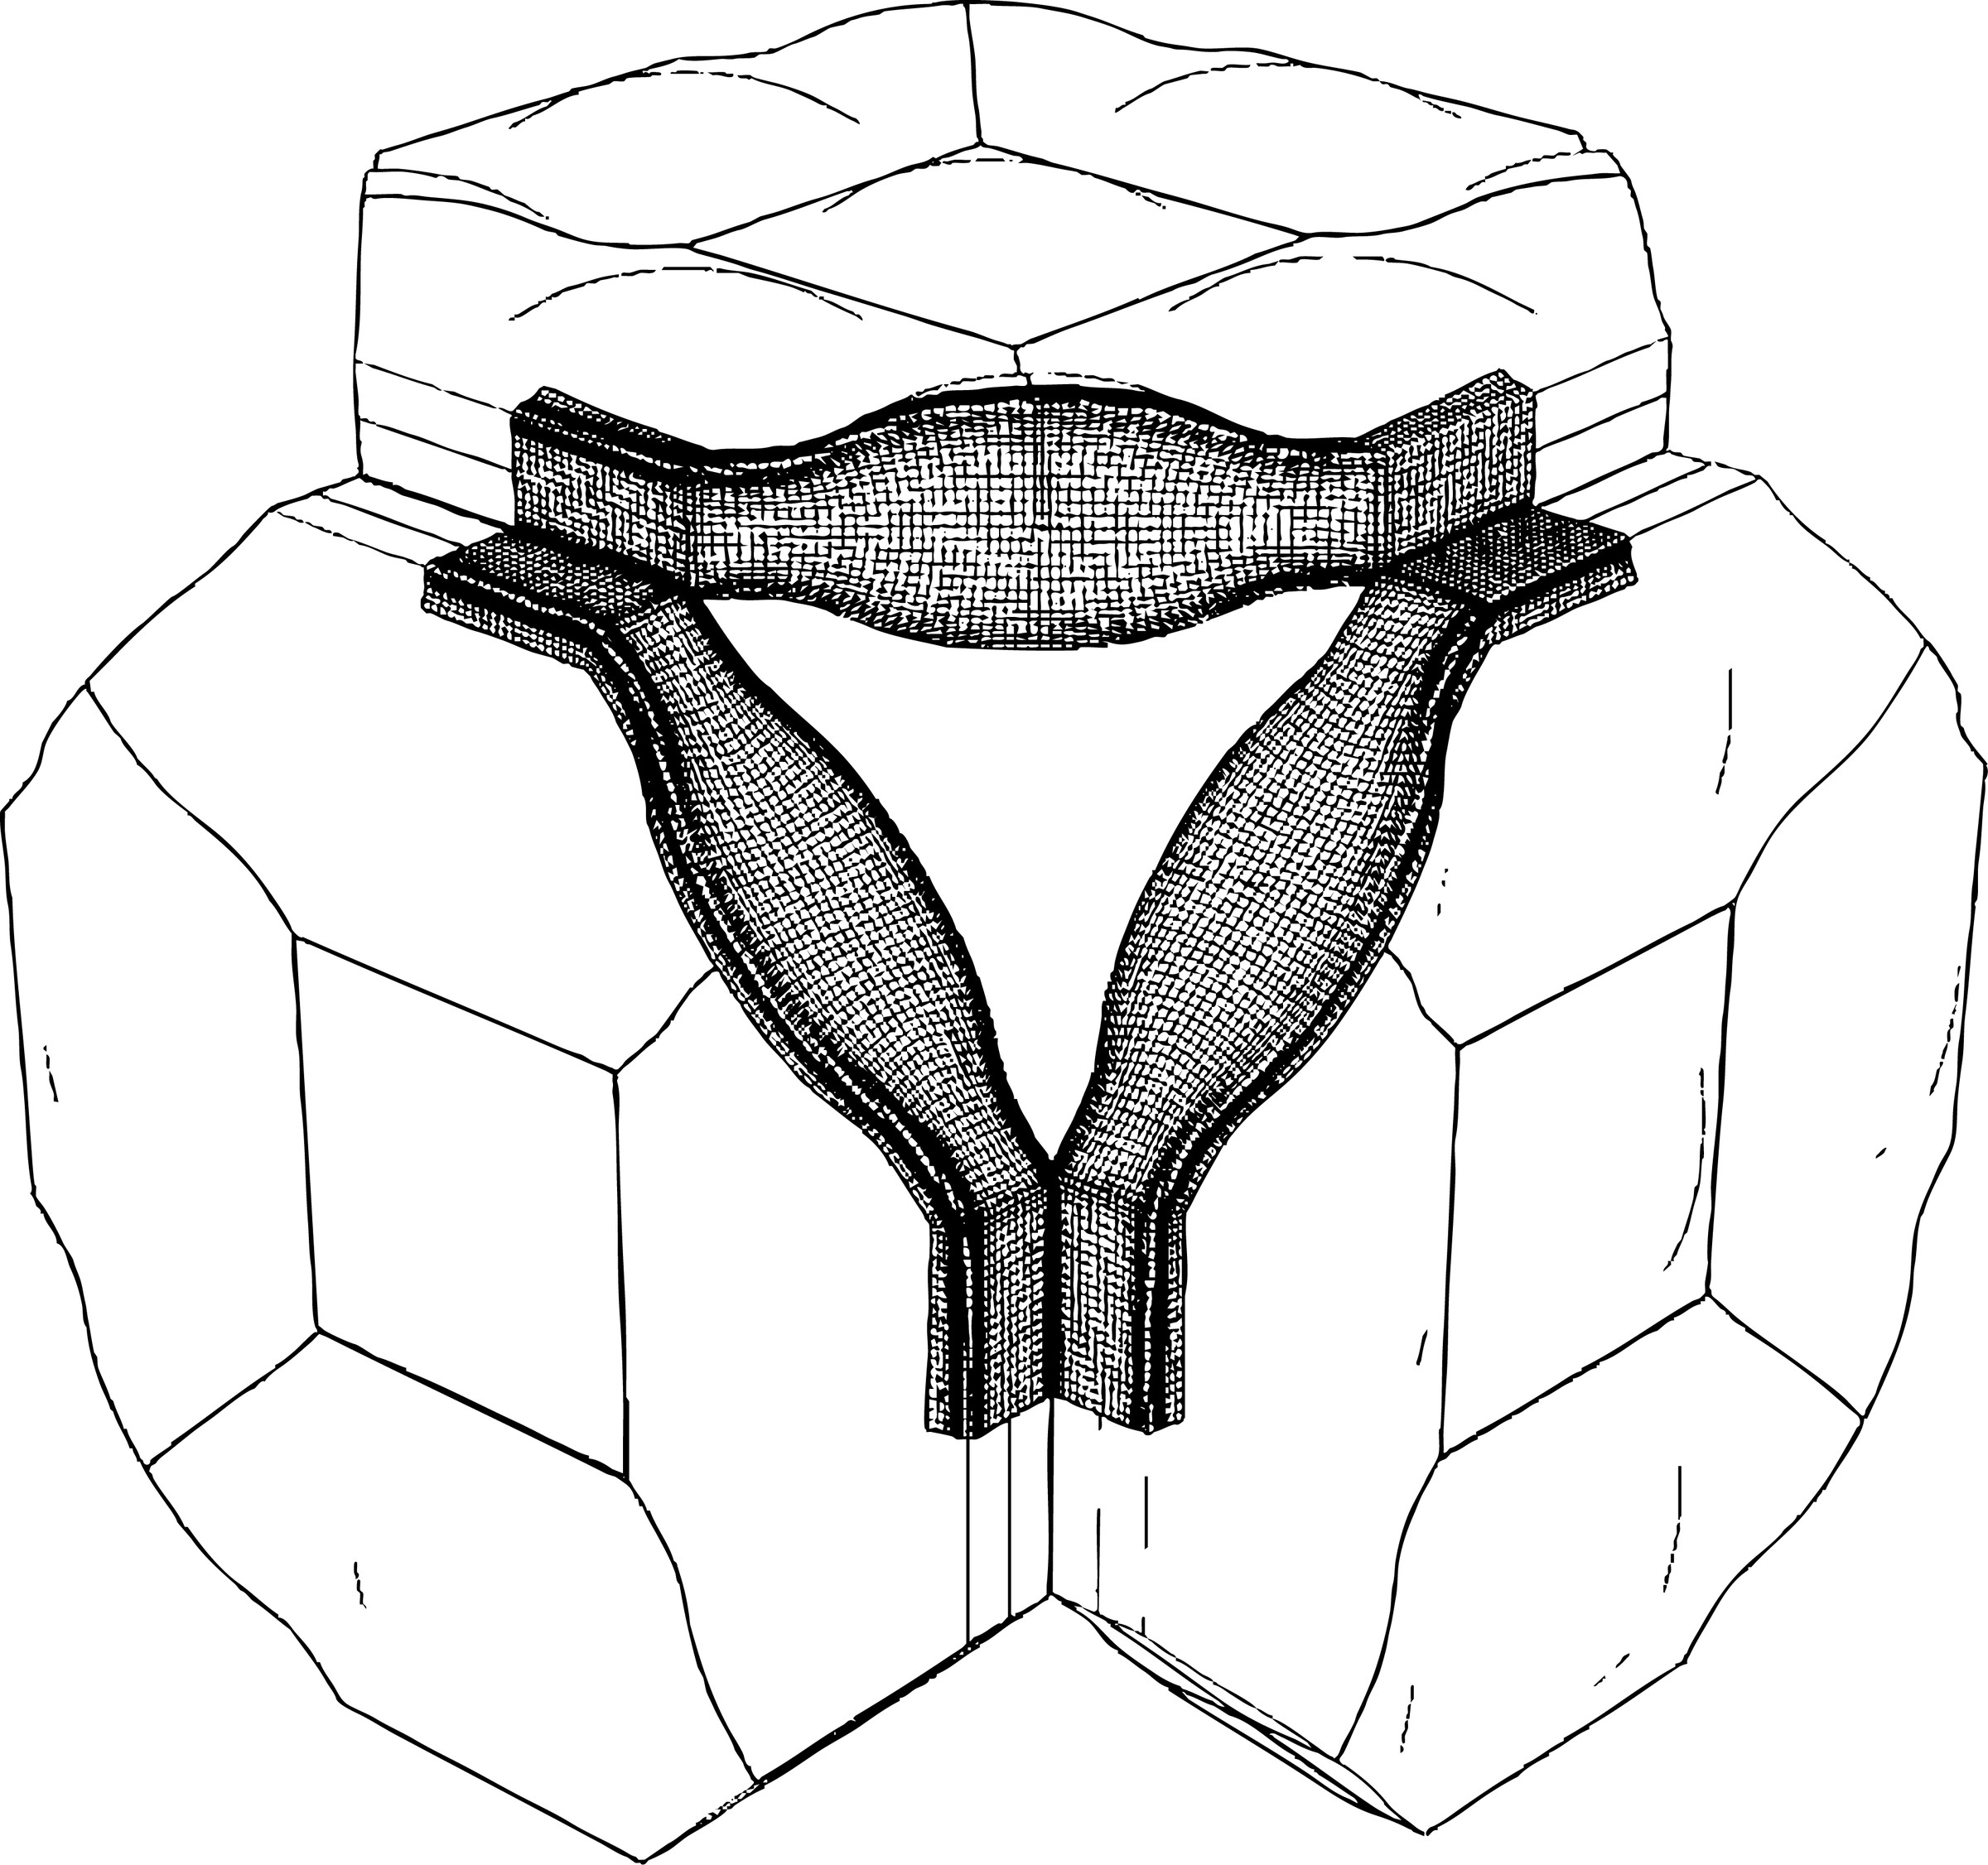
Corner joint ideation
Multi-density myco-block
Multi-Density Myco-Blocks: process film from mold to finished block
Finished block, front
Finished block, three-quarter view showing the dowel holes
Block profile, live and dry
3D-printed fill jig
3D-printed fill jig
Corner joint detail
Corner joint detail
Process notes on the fill jig and assembly

Fill jig development

Changes to design

Reduced material

Holes for dowel alignment

Extensions for clamp attachment

Compression testing

Compression is performed using a hydraulic Carver press at 2–4 metric tons, held for about 10 minutes and reapplied as the material loses height. A parafilm layer prevents sticking and produces consistent panel thicknesses (about 0.8–0.9 cm). Panels that sit too long before pressing dry out, becoming brittle and prone to cracking under higher loads, which makes moisture control critical.

Joinery & assembly

A custom 3D-printed jig aligns panels and introduces material at joints. Earlier assembly allows panels to fuse before final drying, improving continuity across connections. Dowels are added for reinforcement, combining mechanical support with material bonding.

Next steps: corner system + finishing

Next iterations will develop a 3D-printed corner mechanism for more complex assemblies. Surface finishes using carnauba and beeswax are being tested for water resistance and durability, with glycerin additives explored to improve flexibility and reduce cracking.

Panel adhesion

Inert panels adhere to live mycelial growth, so live panels are used to mitigate contaminants

Live blocks are 14% larger than dry blocks

Process notes on the fill jig and assembly
07

Parametric Drawings

Year
Fall 2025–2026
Type
Generative drawing studies
Tools
Rhino Python, Grasshopper
Input
Cursor position, attractor point

One point of interaction, a whole field of variation.

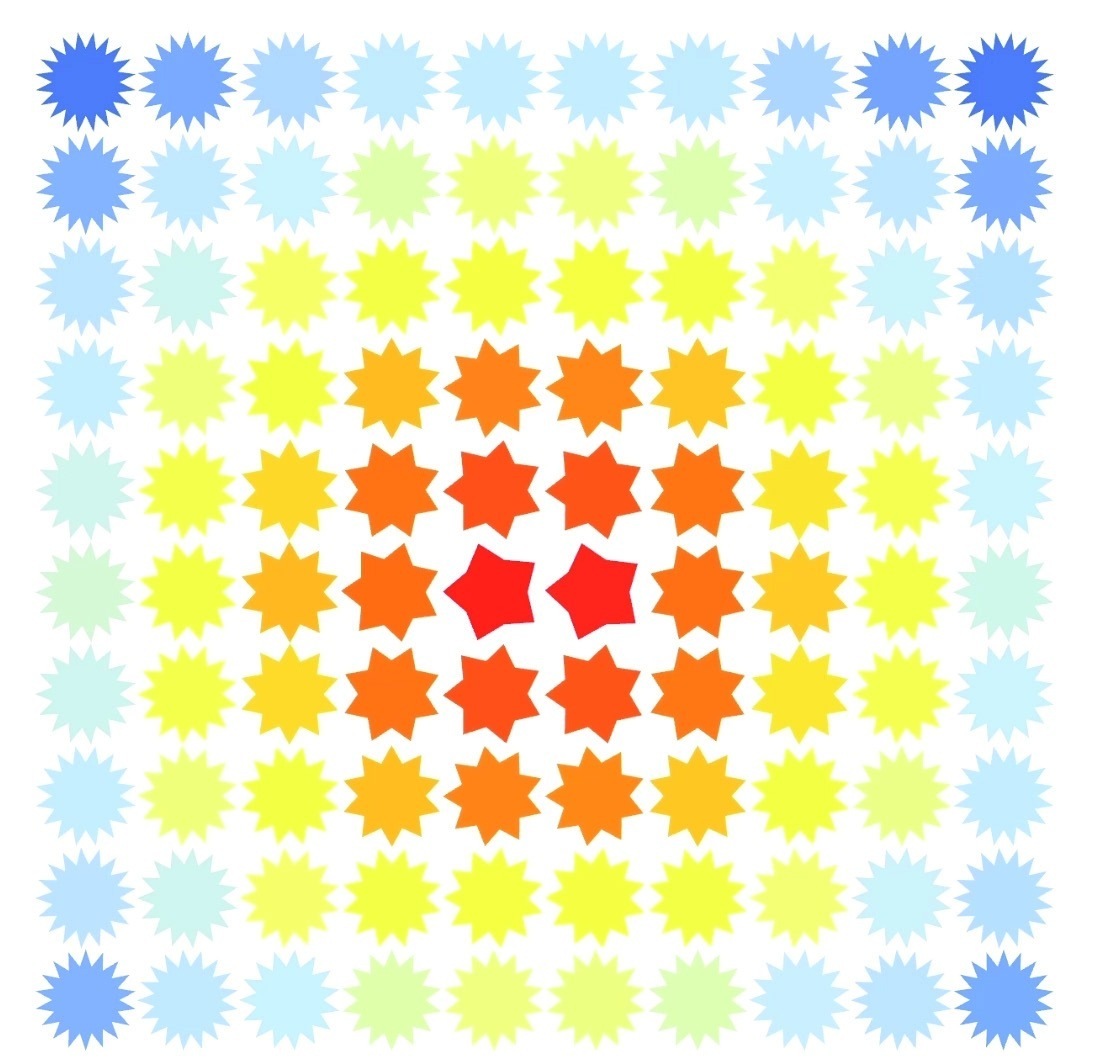
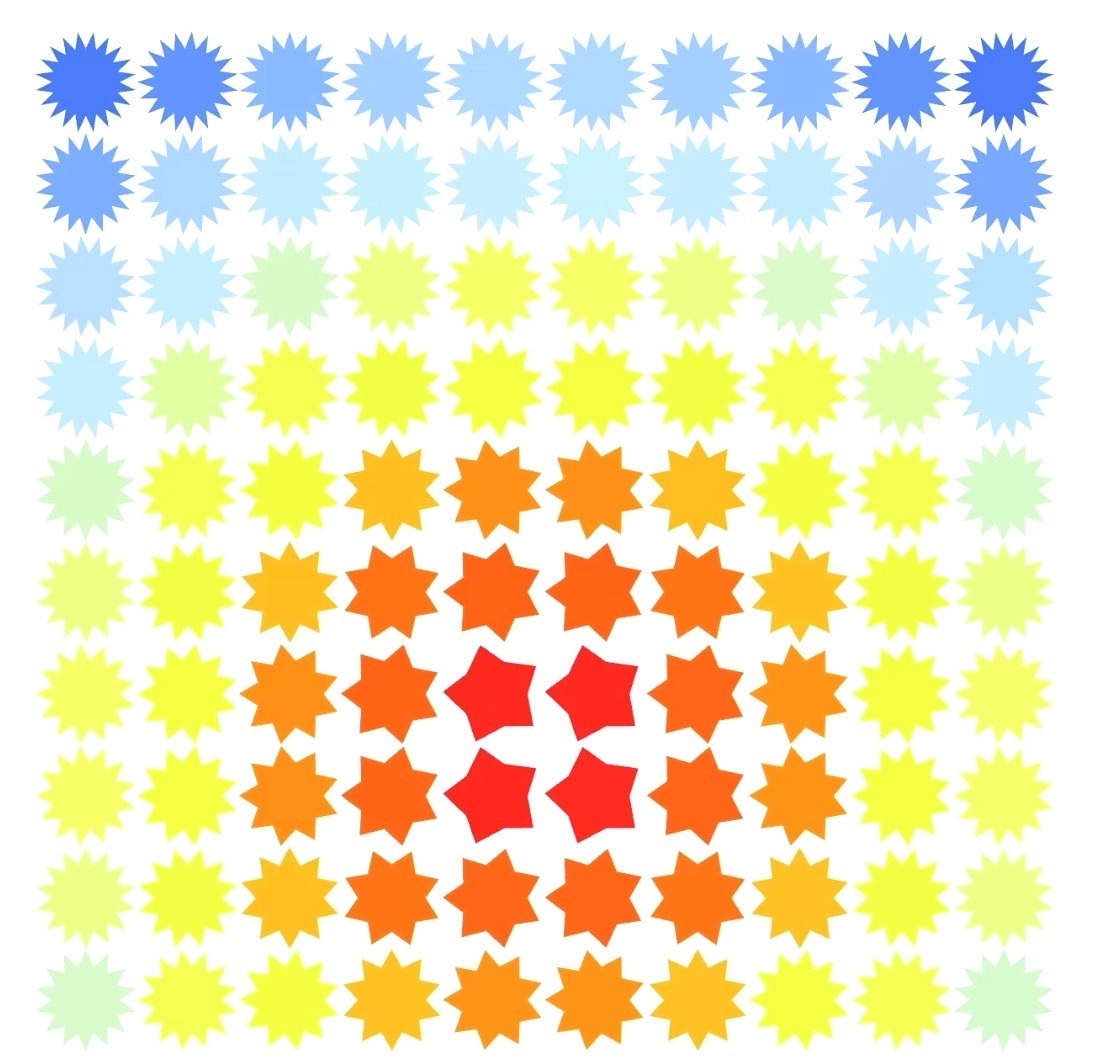
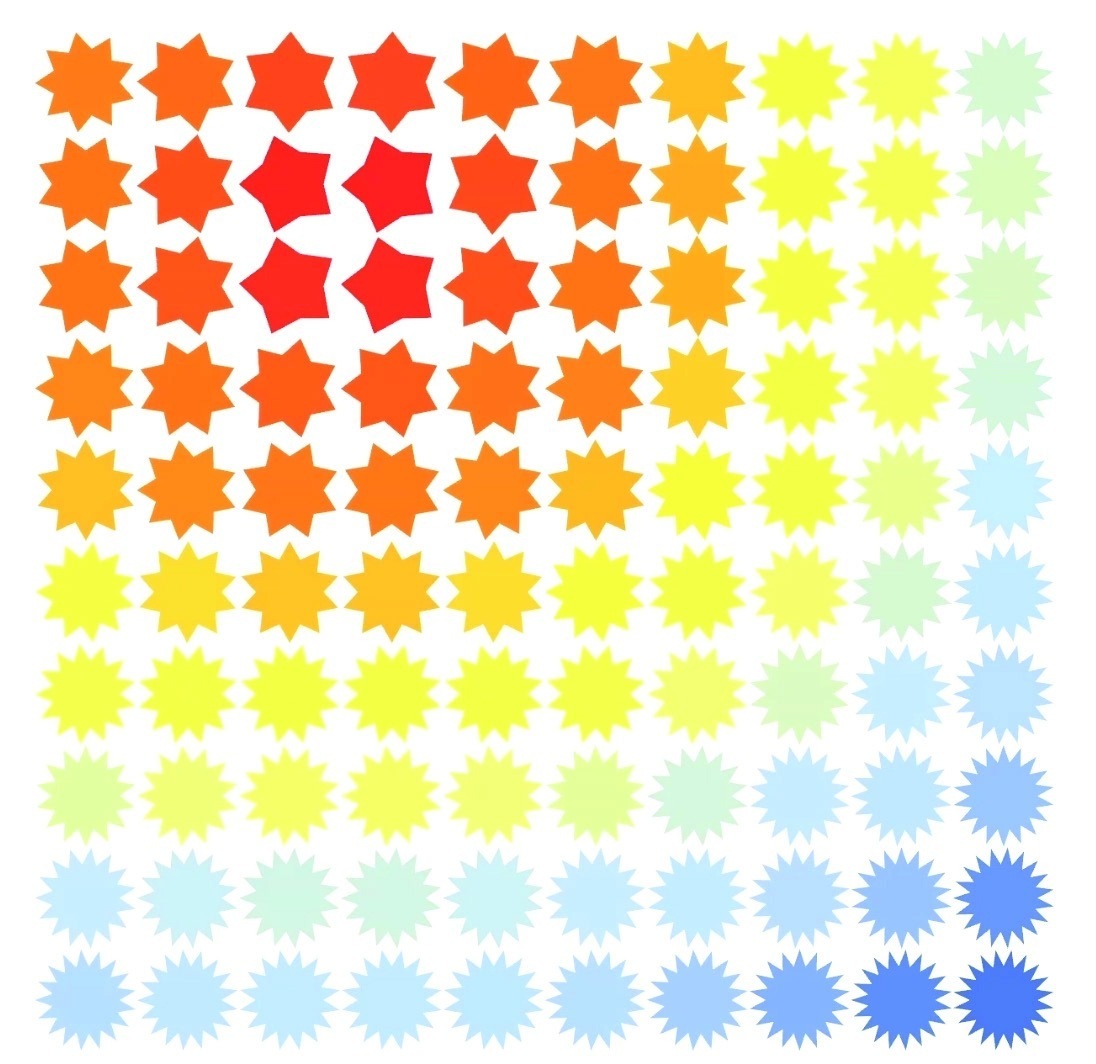
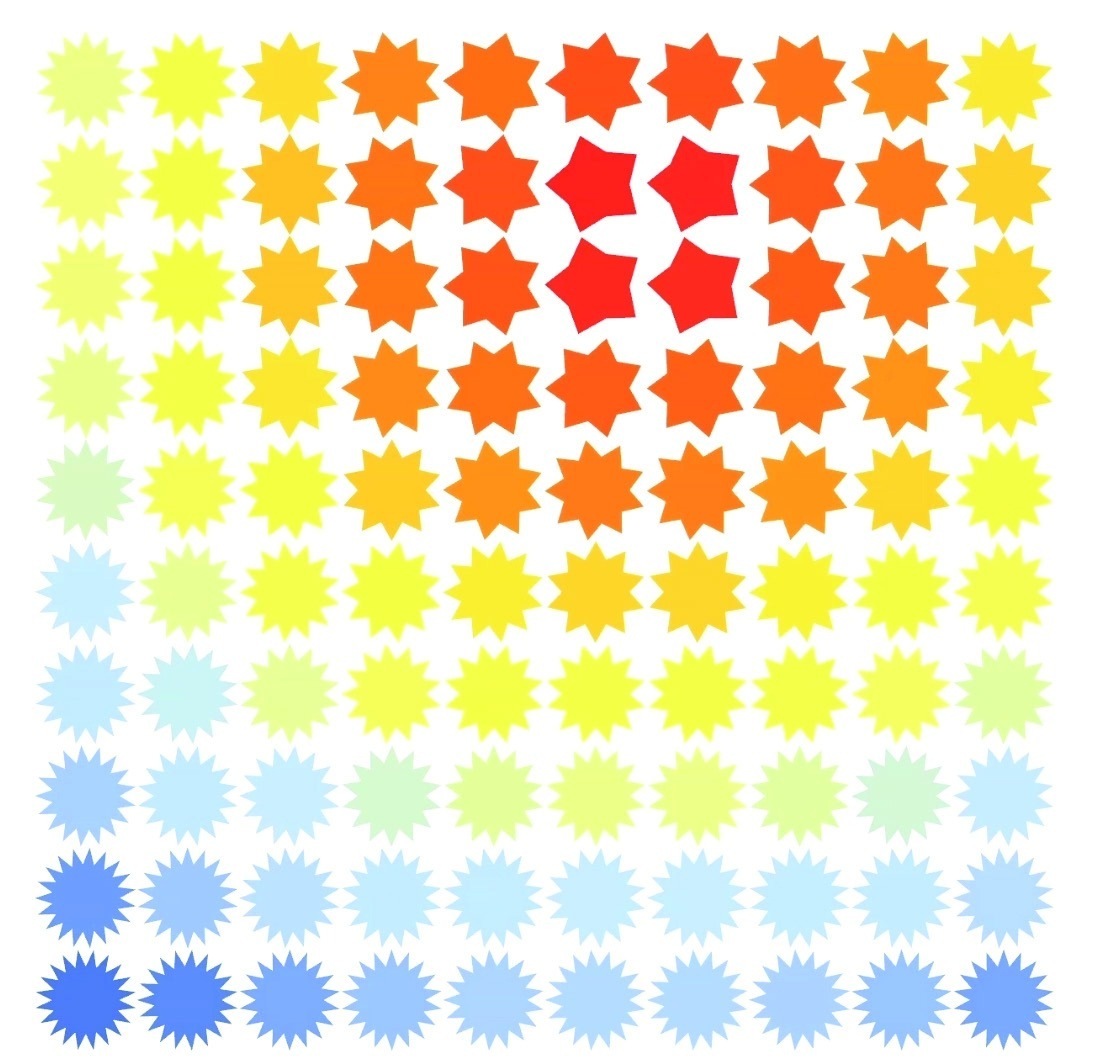
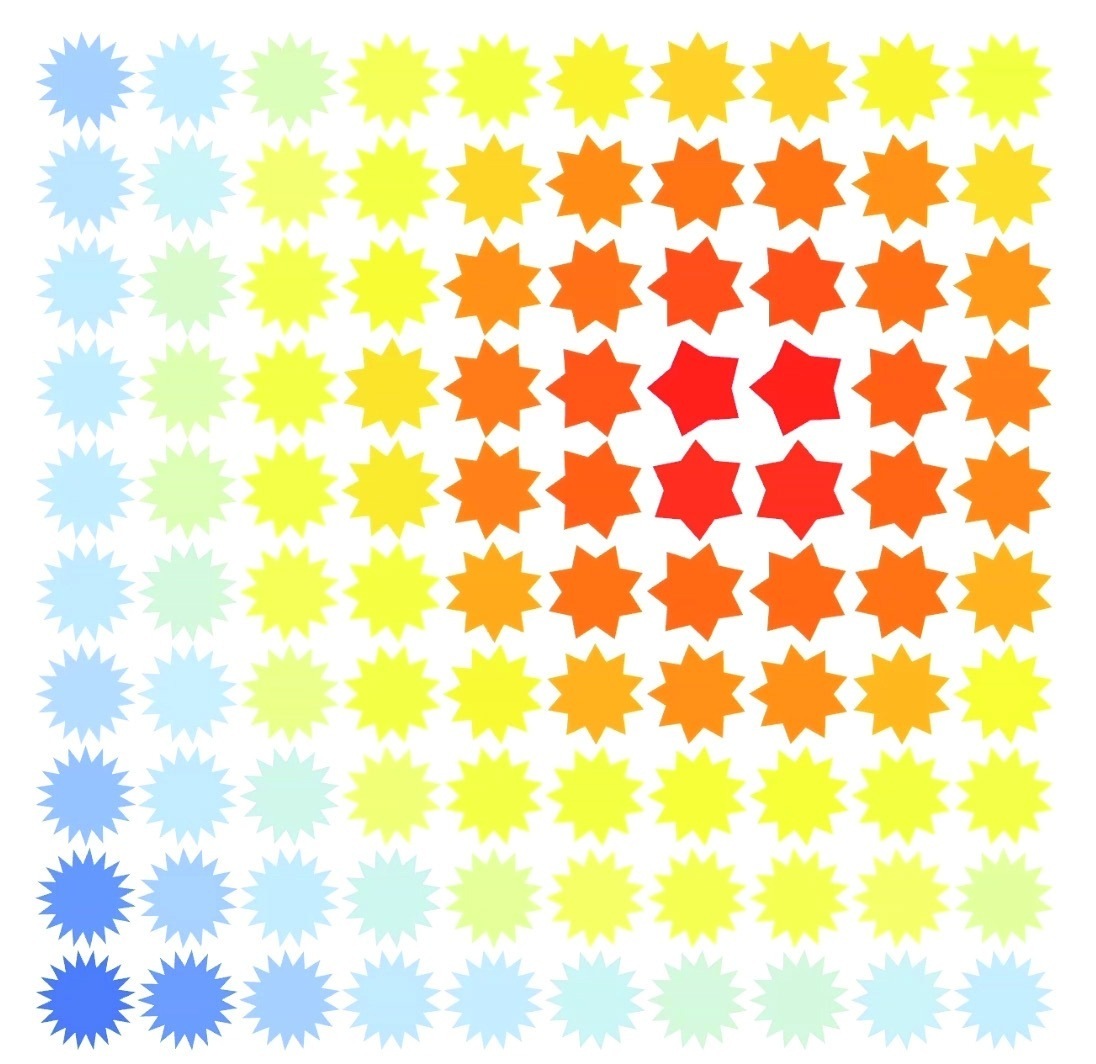
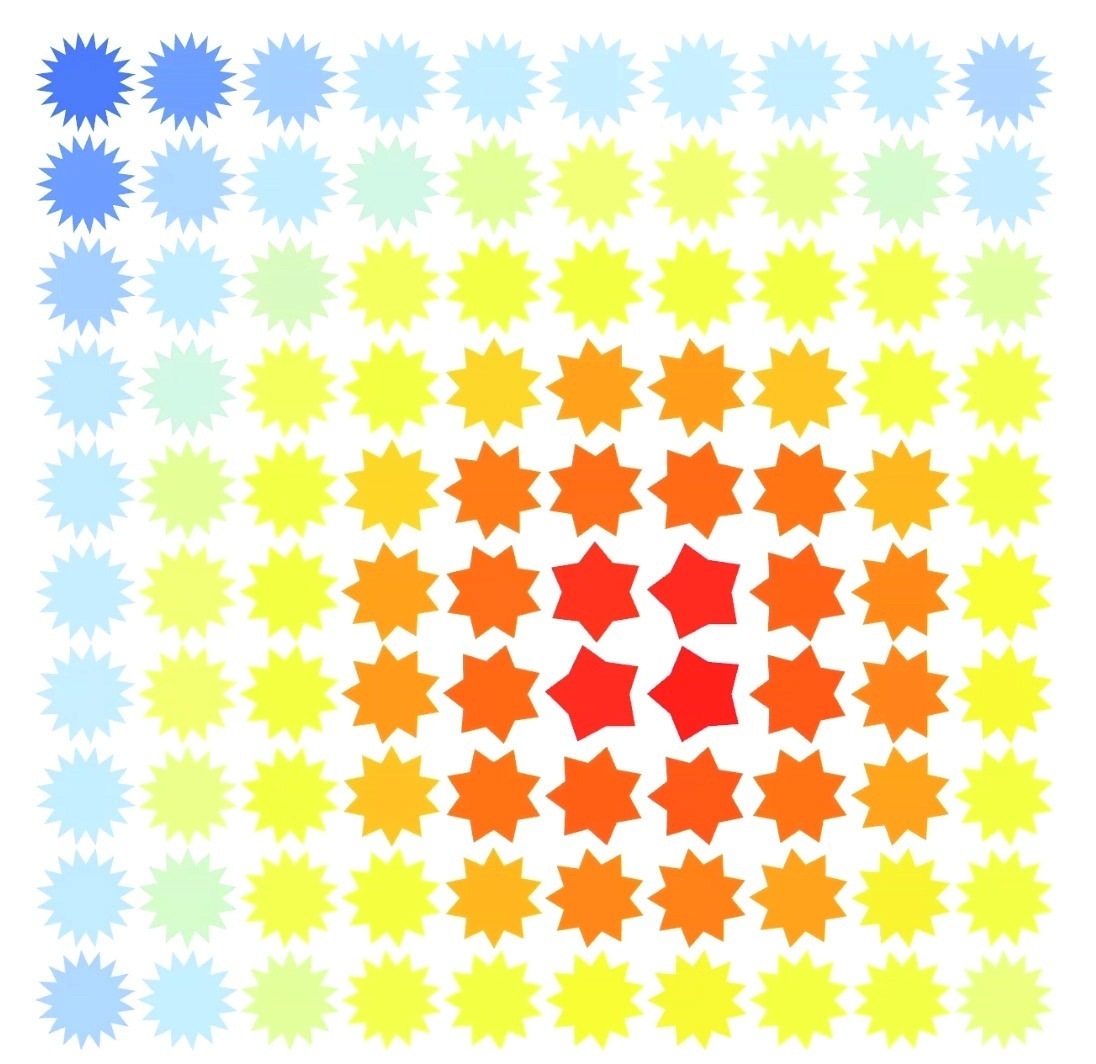
In the first study, a grid of radial shapes is continuously shaped by the cursor. Each shape measures its distance to the cursor and remaps that value to the number of points that construct its form: closer shapes simplify, farther ones grow more complex, giving a gradual transition across a coherent field.

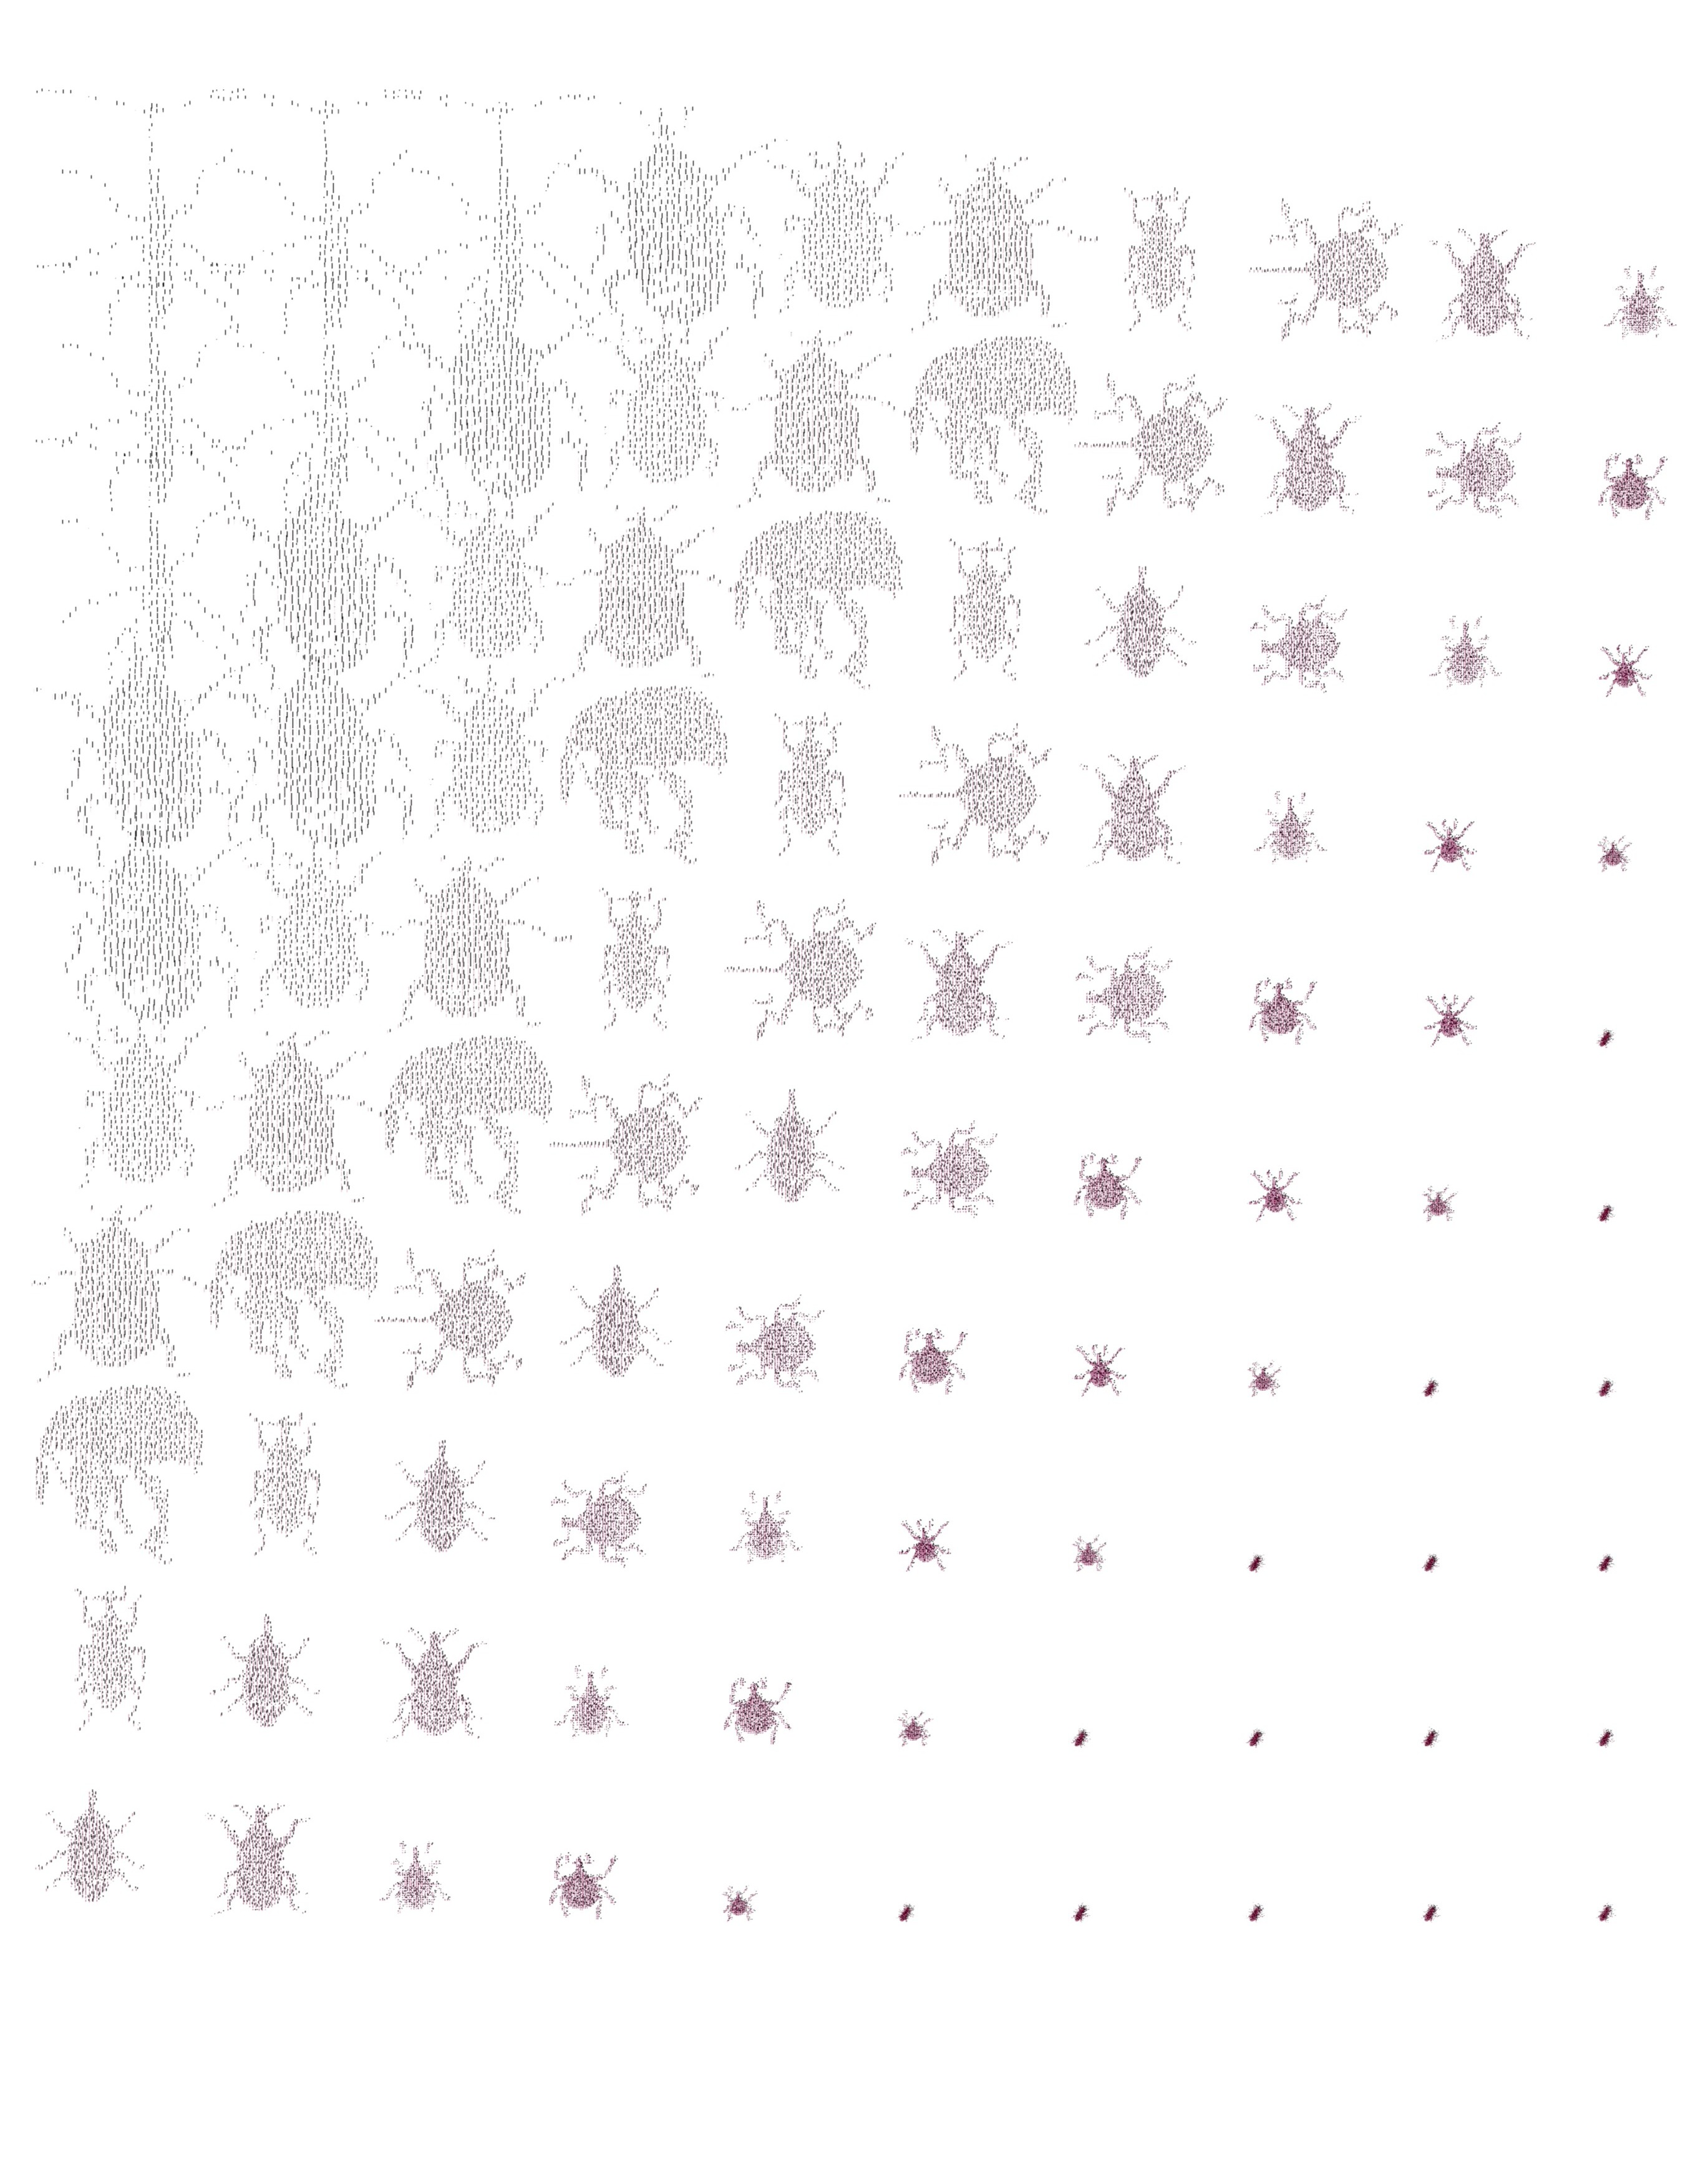
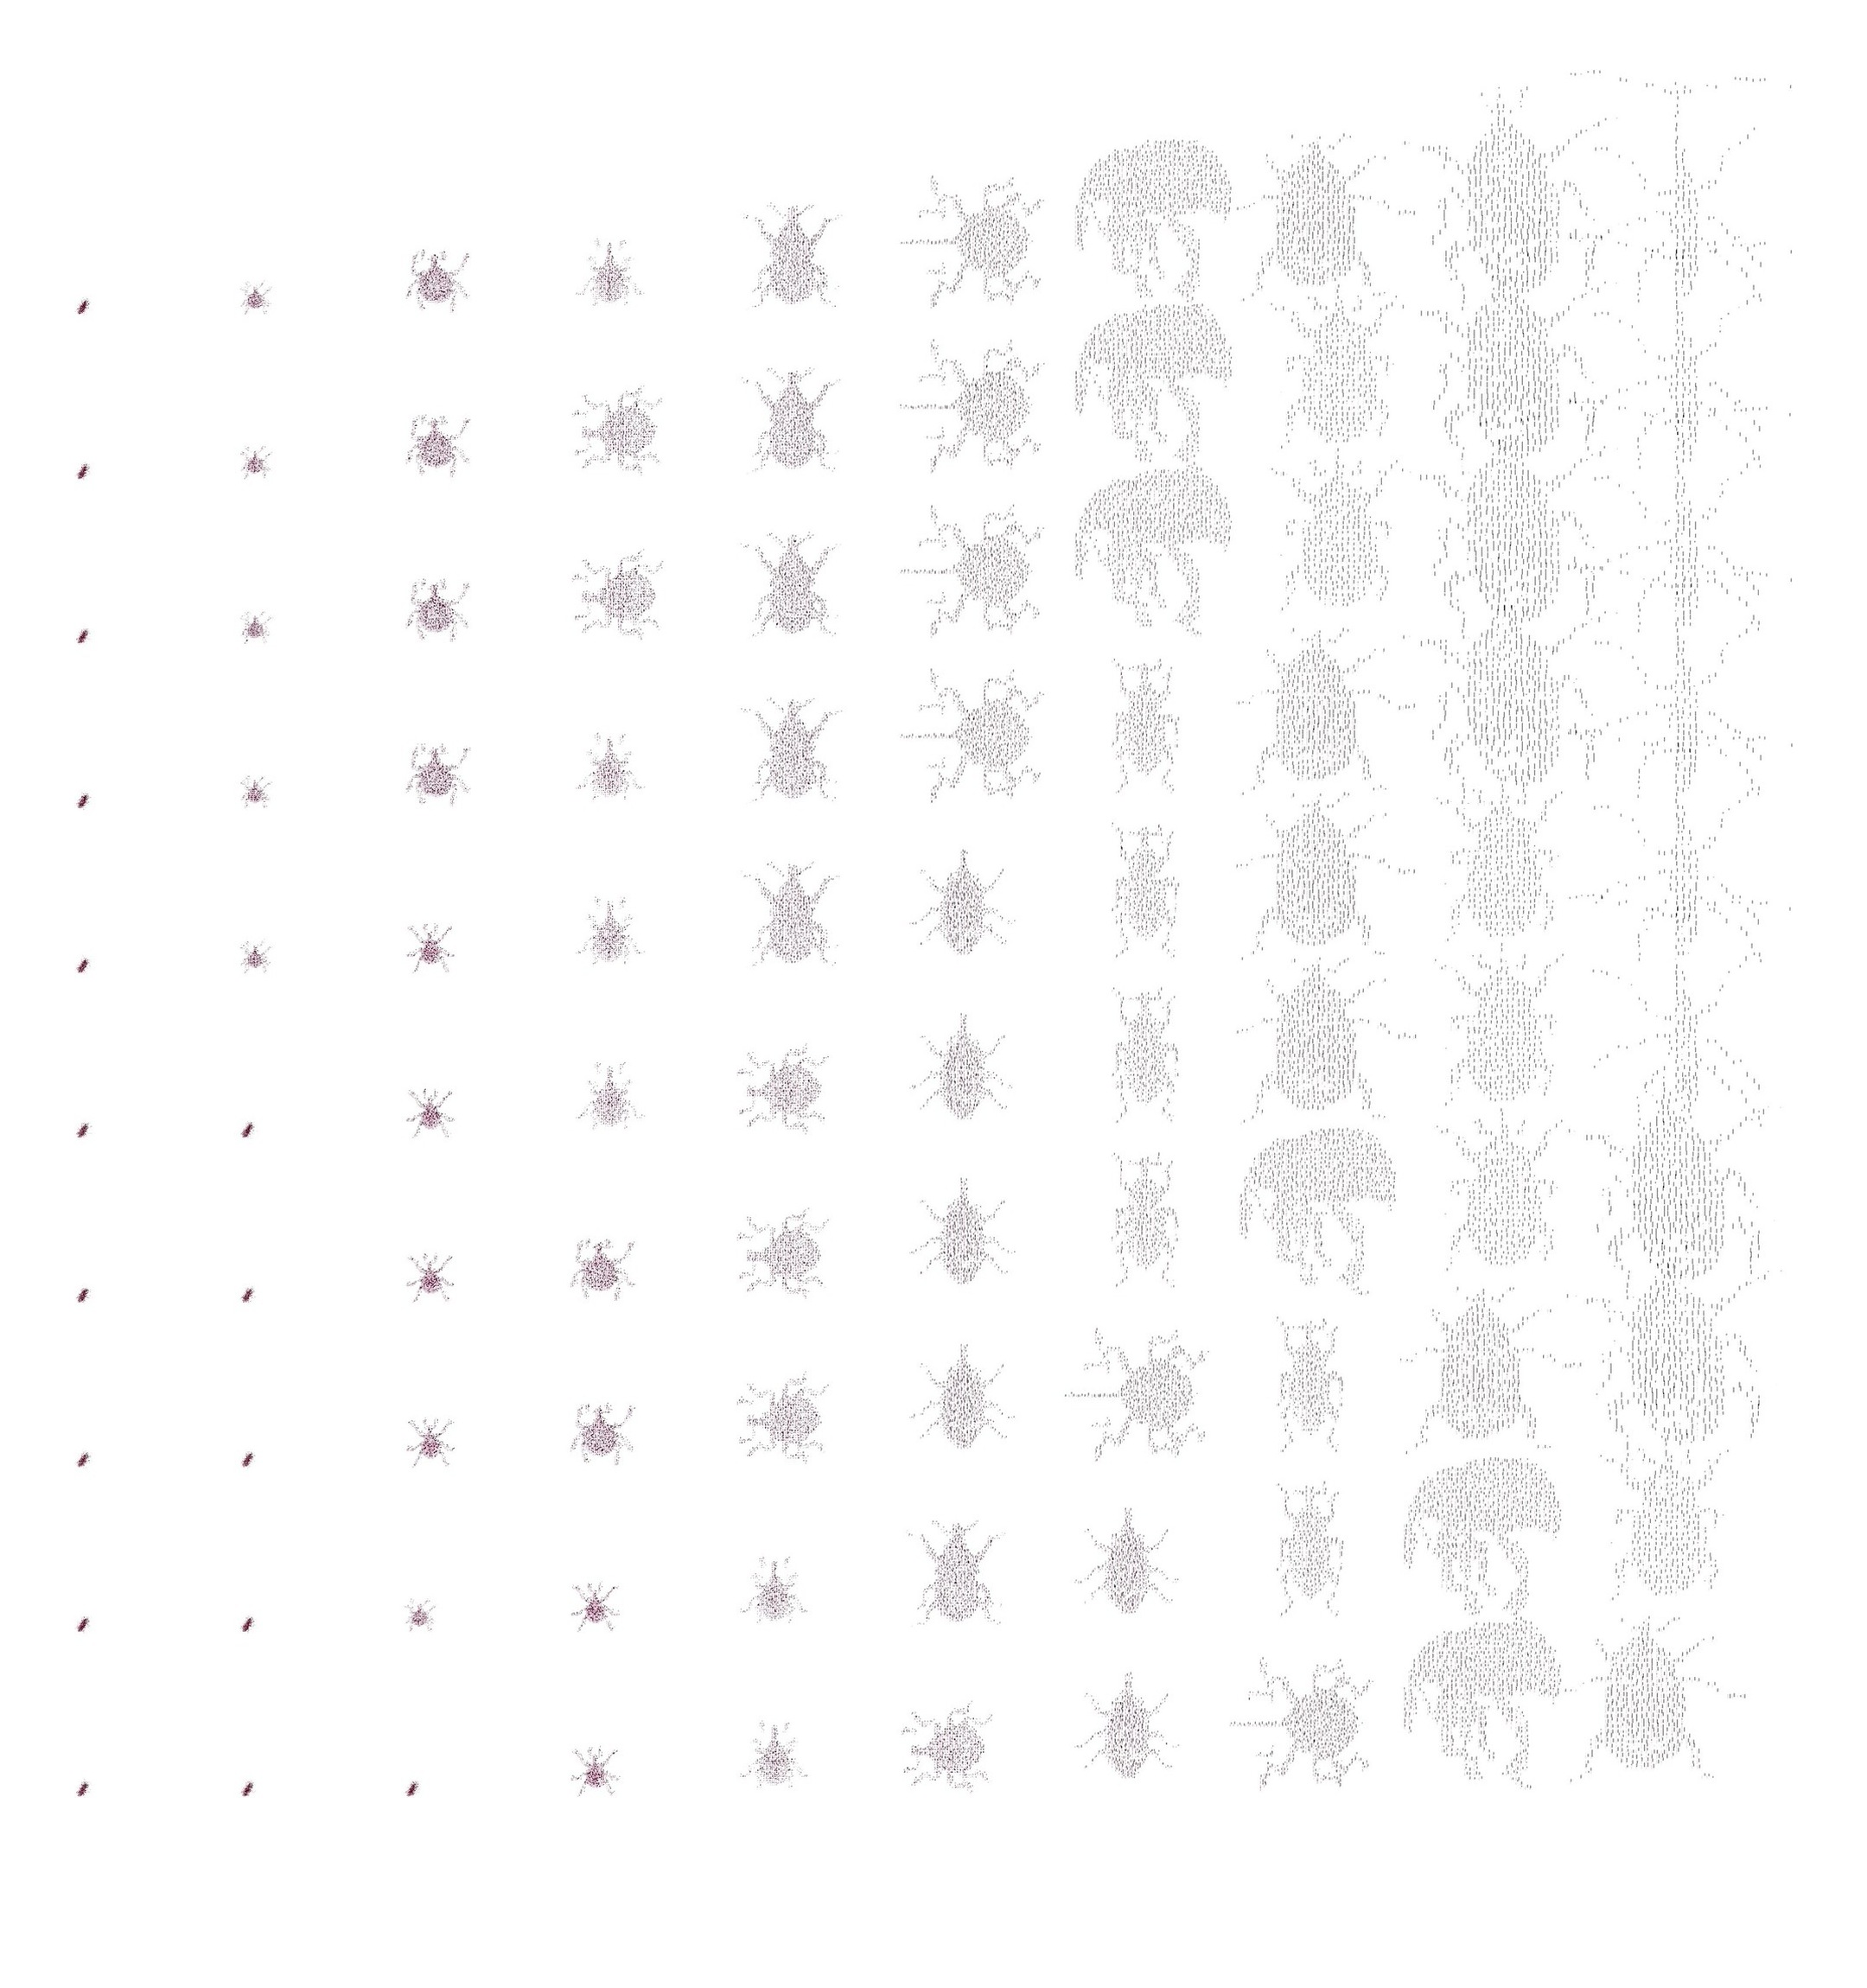
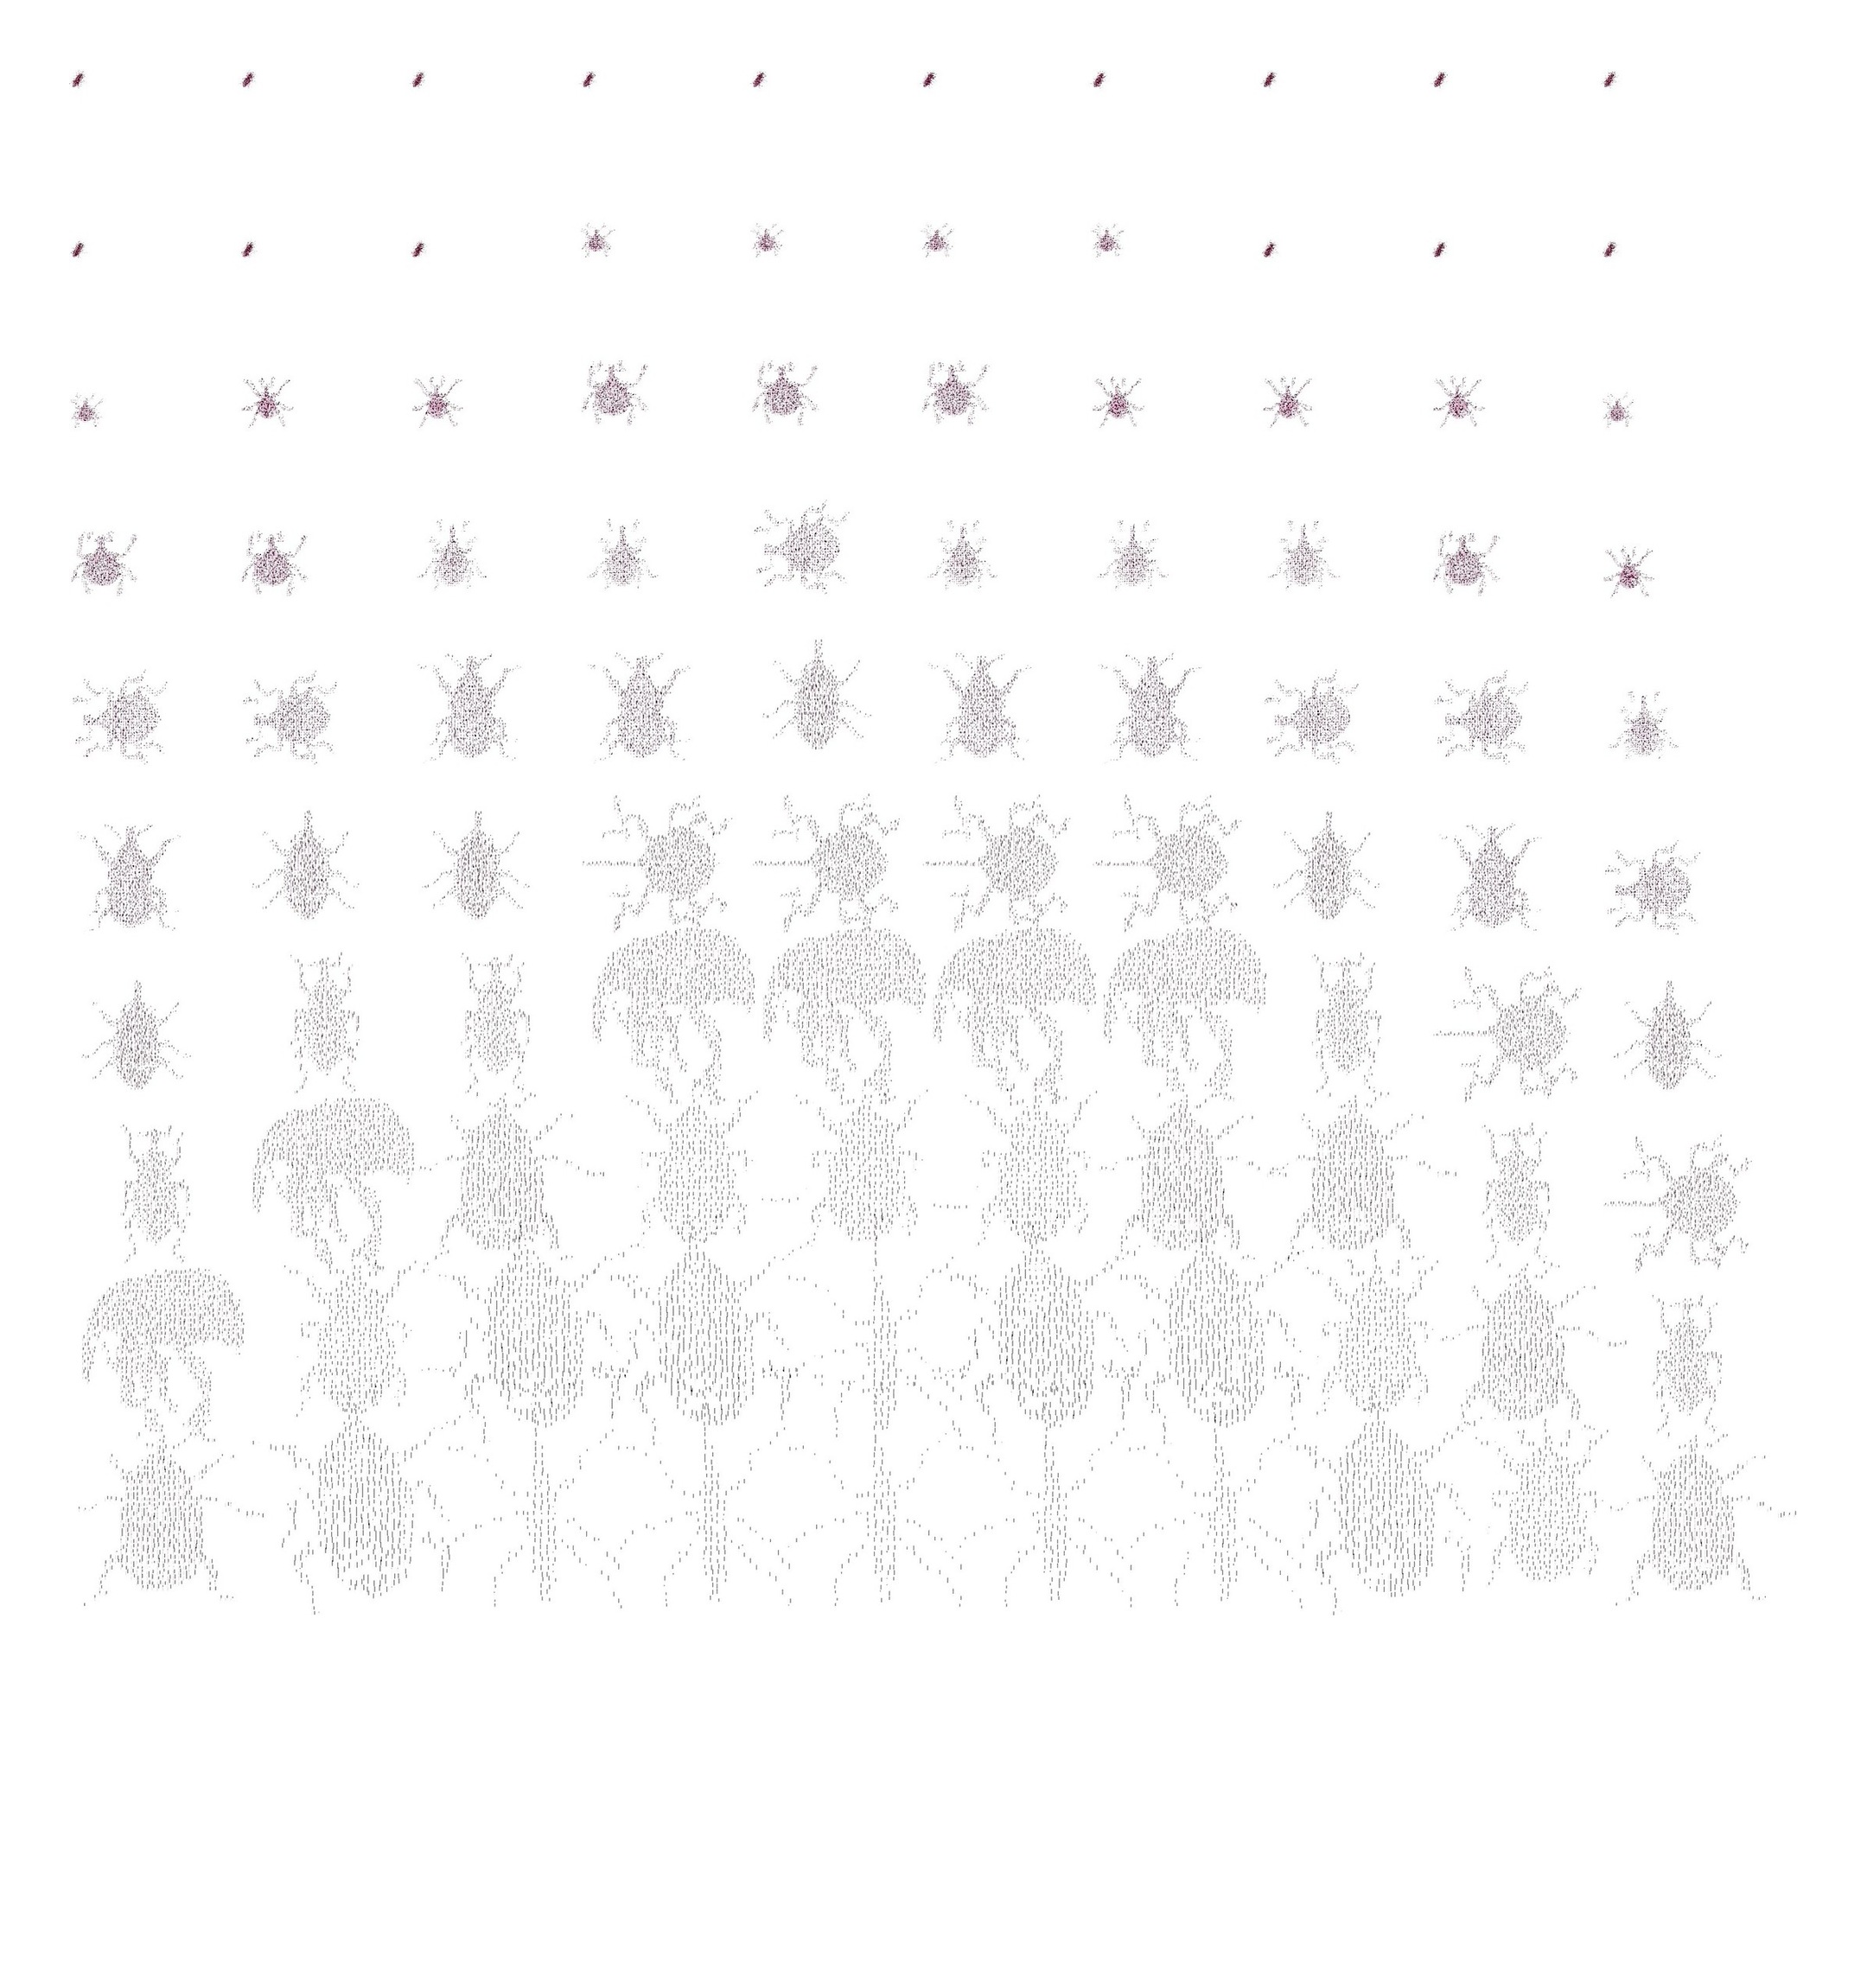
In the second, a 50 by 50 point grid is ranked by distance to an attractor and divided into bins. Each bin draws a different weevil illustration, resampled pixel by pixel into line geometry with Rhino Python, and the drawings shrink with distance, so one point organizes the field from detailed insects to fine specks.

Weevil field: attractor-ranked bins, Rhino Python
Cursor position 1
Cursor position 1
Cursor position 2
Cursor position 2
Cursor position 3
Cursor position 3
Cursor position 4
Cursor position 4
Cursor position 5
Cursor position 5
Cursor position 6
Cursor position 6
Cursor position 7
Cursor position 7
Cursor position 8
Cursor position 8
Weevil field, variation

Publication

Progress in Developing a Bark Beetle Identification Tool

G. Christopher Marais, Isabelle C. Stratton, Andrew J. Johnson, Jiri Hulcr

Abstract

This study presents a tool for the identification of bark beetles. These pests are known for their potential to cause extensive damage to forests globally, as well as for uniform and homoplastic morphology which poses identification challenges. Utilizing a MaxViT-based deep learning model is an innovative approach to classify bark beetles down to the species level from images containing multiple beetles. The methodology involves a comprehensive process of data collection, preparation, and model training, leveraging pre-classified beetle species to ensure accuracy and reliability. The model’s high F1 score estimates of 0.99 indicates its exceptional performance, demonstrating a strong ability to accurately classify species, including those previously unknown to the model. This makes it a valuable tool for applications in forest management and ecological research. Despite the controlled conditions of image collection and potential challenges in real-world application, this study provides the first model capable of identifying the bark beetle species, and by far the largest training set of images for any comparable insect group. We also designed a function that reports if a species appears to be unknown. Further research is suggested to enhance the model’s generalization capabilities and scalability, emphasizing the integration of advanced machine learning techniques for improved species classification and the detection of invasive or undescribed species.